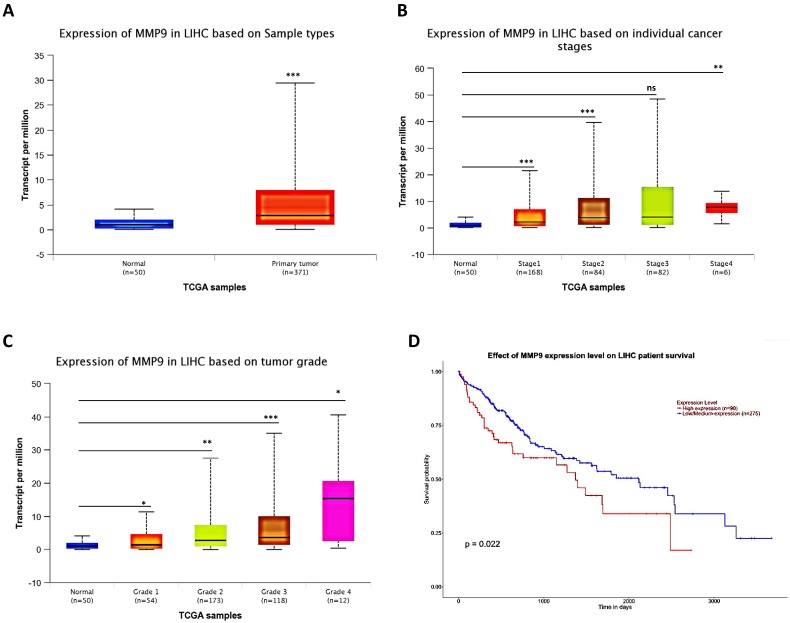
Figure 5.
Human Clinical study to link the miR-149-5p-MMP9 axis to the HCC progression. (A) HCC patients' from TCGA database shows different expression of MMP9 in normal tissue and primary tumor tissue. (B) The TCGA data shows expression of MMP9 in HCC samples based on different individual cancer stages. (C) The TCGA data shows expression of MMP9 in HCC samples based on different tumor grade. (D) The TCGA data shows effect of MMP9 expression level on HCC patient survival. All quantifications are mean ± SD, *p < 0.05, **p < 0.01, ***p < 0.001 ns: no significant difference.

