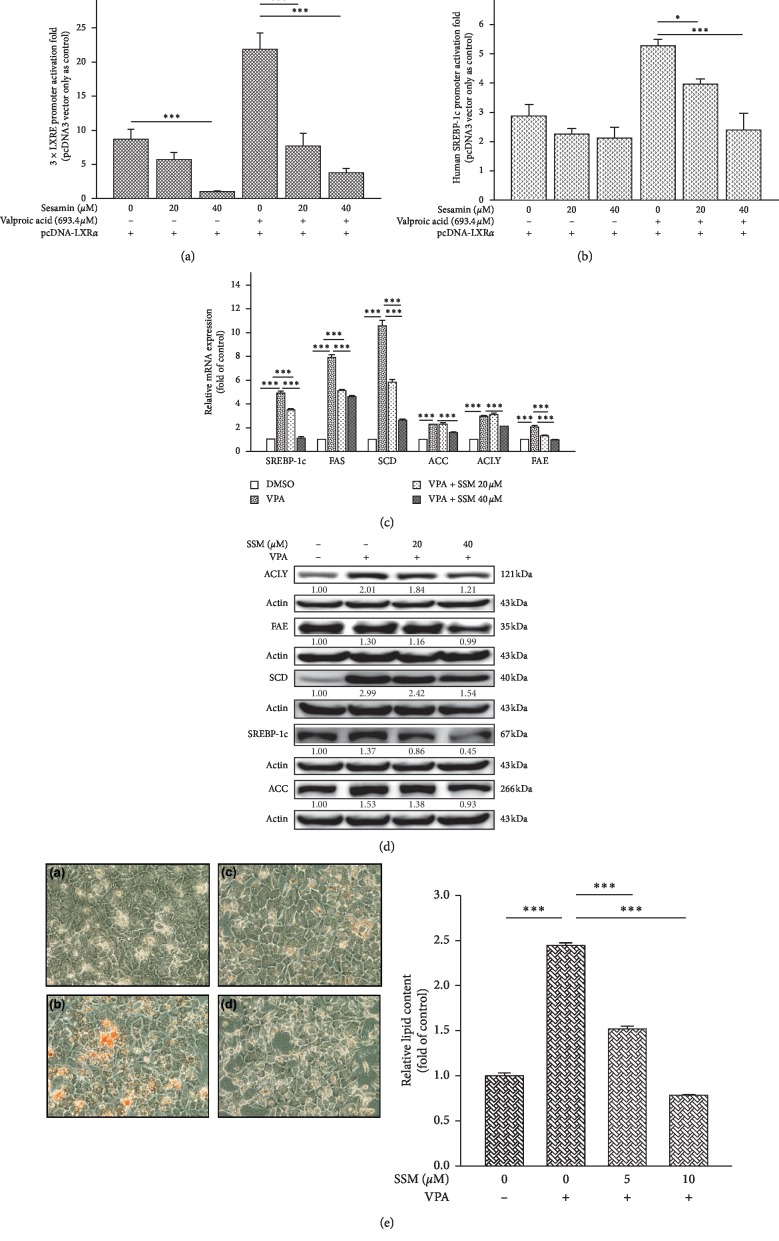
Figure 5.
Sesamin (SSM) attenuates valproate- (VPA-) induced transient transcriptional assays of 3 × LXRE and SREBP-1c reporter activity, LXRα target genes mRNA and protein expressions, and lipid content. HepG2 cells were cotransfected with an LXRα expression plasmid and (a) 3 × LXRE-Luc and (b) SREBP-1c-Luc reporter genes and treated with 20 or 40 μM SSM alone or in combination with 693.4 μM VPA for 24 h. Data represent the mean ± SE; n = 4; ∗p < 0.05; ∗∗∗p < 0.001 compared with control or T090-treated groups as indicated. (c) Differentiated HepaRG cells treated with 20 or 40 μM SSM alone or in combination with 693.4 μM VPA for 24 h. Quantitative real-time PCR results of gene expression levels of SREBP‐1c, FAS, SCD, ACC, ACLY, and FAE are shown. β-actin was used as an internal control. Data represent the mean ± SE; n = 3; ∗∗∗p < 0.001 compared with control or VPA-treated groups as indicated. (d) Differentiated HepaRG cells treated with VPA and SSM alone or in combination for 24 h were harvested, and their protein levels of LXRα target genes and β-actin (internal control) were analyzed via western blot. Quantitation of the indicated protein bands was corrected by β-actin expression. The representative blot shown was quantified with ImageJ software. (e) Differentiated HepaRG cells were repeatedly exposed to (A) solvent, (B) 693.4 μM VPA, (C) 693.4 μM VPA + 5 μM SSM, and (D) 693.4 μM VPA + 10 μM SSM for 14 days. Lipid accumulation was then assessed using Oil Red O staining, which allows the detection of triglycerides and cholesterol esters. HepaRG cells were observed and photographed under a phase‐contrast microscope (original magnification ×400). Oil red O dye was then extracted using isopropanol and quantified with a microplate reader at 510 nm. Values represent the mean ± SE; n = 3; ∗∗∗p < 0.001 compared with control or T090-treated groups as indicated.

