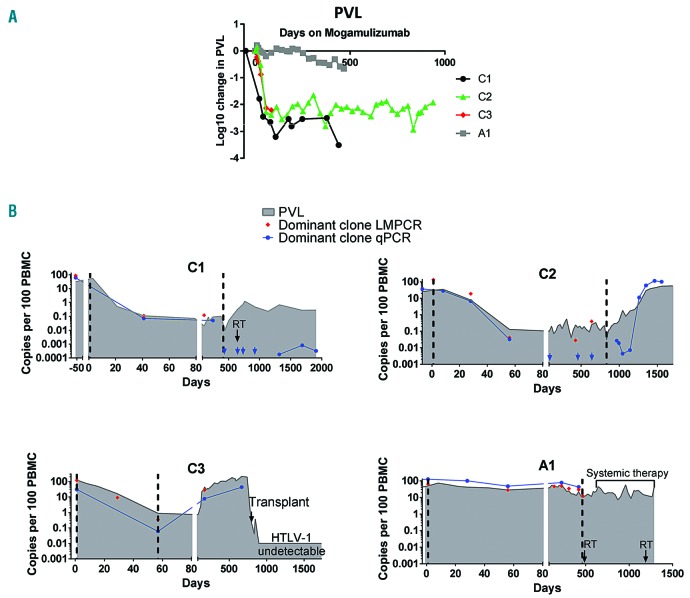
Figure 1.
Proviral load and minimal residual disease kinetics of four ATL patients. (A) Proviral load (PVL) during treatment with mogamulizumab. The proportion of peripheral blood monanuclear cells (PBMC) infected with HTLV-1 was estimated by quantitative PCR (qPCR) for HTLV-DNA and the beta globin gene using a method previously reported in Demontis et al.15 For each time point, log change was calculated using the formula: log10((time point value)/(premogamulizumab value)). (B) Kinetics of malignant (red and blue) and HTLV-1-infected cells (grey filled) in the study cohort. HTLV-1 integration sites were mapped using the ligation-meditated PCR (LM-PCR)/high throughput sequencing protocol described in detail in Gillet et al.12 Primers were designed to specifically amplify sequences unique to the malignant clone in each patient by pairing a primer located in the 3’LTR of HTLV-1 with a primer located in the human genome adjacent to the dominant HTLV-1 integration site.11 In the case of patient C2, the dominant integration site was located in a repetitive region of the human genome. Thus, specific primers were designed which amplified DNA of the rearranged T-cell receptor (TCR) in the malignant clone. The first (Cycle 1, day 1) and last mogamulizumab infusions are indicated by vertical dashed lines. RT indicates localized radiotherapy (black arrows). Copy numbers were estimated by quantitative PCR (blue) and linker-mediated PCR and next-generation sequencing (red), and expressed per 100 PBMC. Blue arrows indicate time points at which the malignant clone was undetectable by qPCR.

