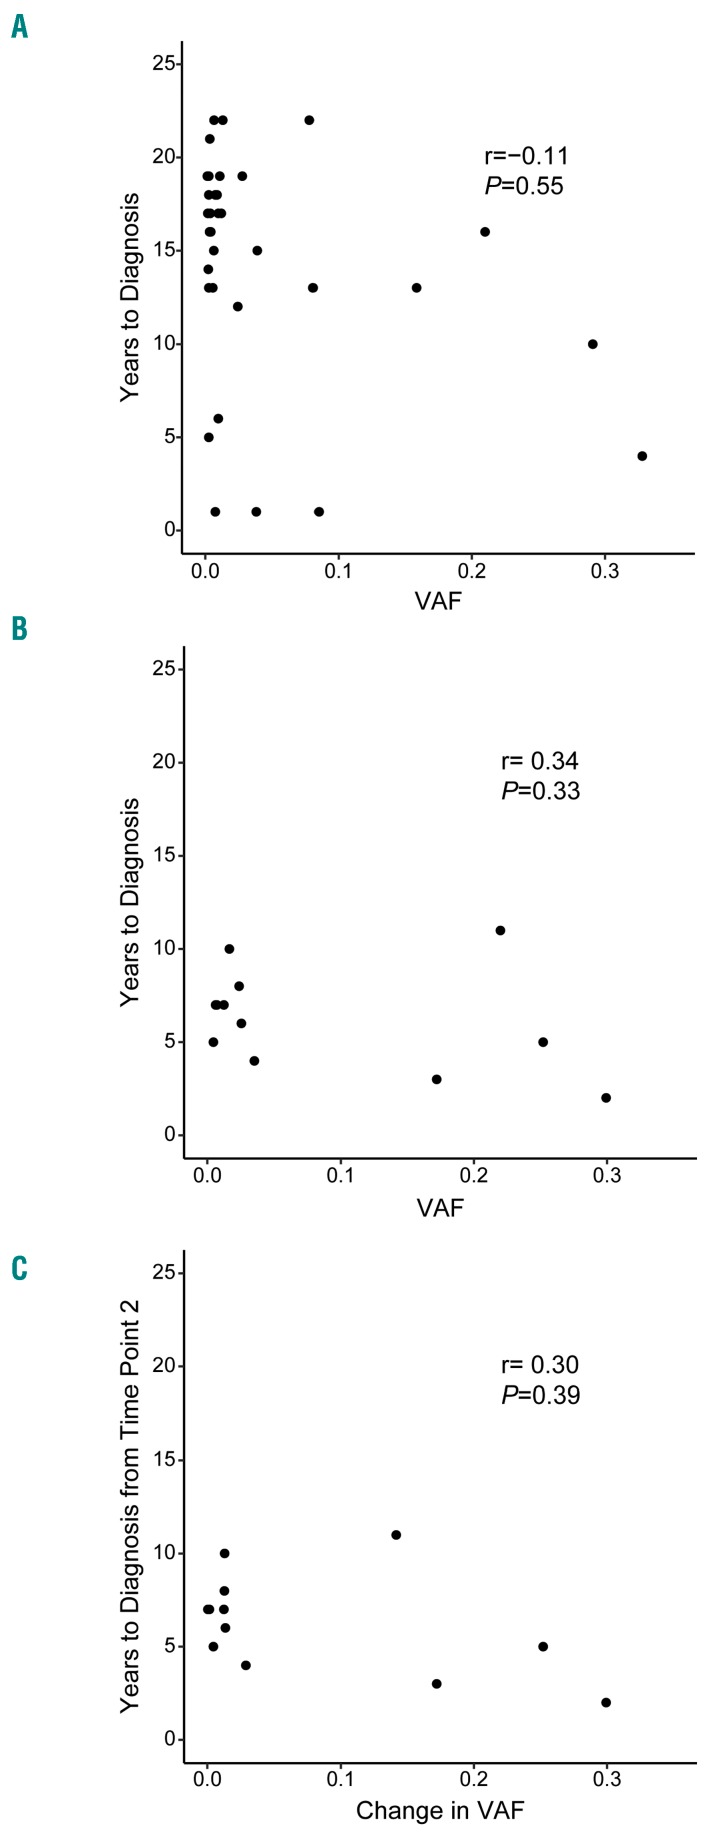
Figure 3.
Comparison between the largest variant allele fraction (VAF) or largest change in VAF per individual with acute myeloid leukemia (AML) (x-axis) and the time to AML diagnosis (y-axis). (A) The VAF for the most common mutation observed in a first or only blood collection sample is plotted relative to the time to AML diagnosis from the date of first or only blood collection. (B) The VAF for the most common mutation observed in a second blood collection sample is plotted relative to the time to AML diagnosis from the date of second blood collection. (C) The time from the second blood draw to AML diagnosis in participants with two blood samples, based on the largest observed increase in VAF between the first and second blood collections (regardless of the corresponding variant).

