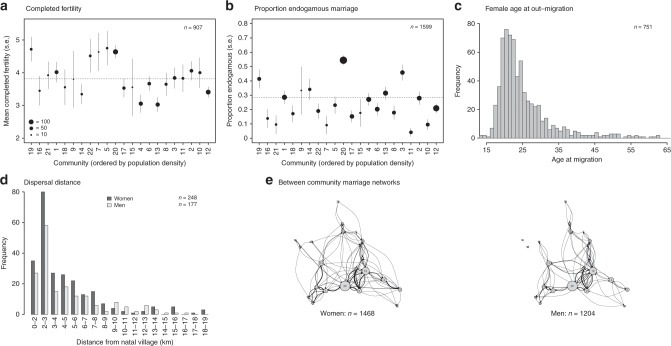
Fig. 1. Demography of the study communities.
Between-community variation in a completed fertility (women aged 45+), and b proportion of endogamous marriages (means are indicated by dashed lines); c age at out-migration for women; d frequency distribution of distances between natal and post-marital residence for men and women, and e marriage connections between communities for women (left) and men (right). Communities in a, b are ordered from left to right by increasing population density. Communities in (e) are shown in relative geographic space: edge width indicates the frequency of people moving to a particular community after marriage. Data are provided in a Source Data file.

