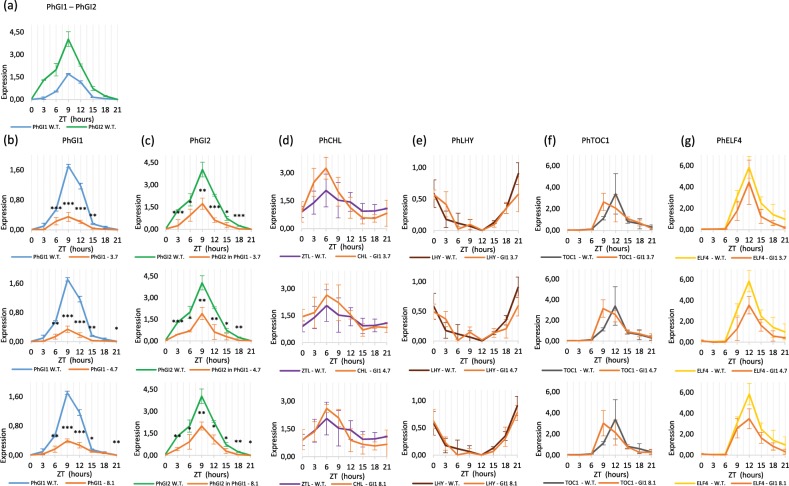
Figure 1.
Expression profile during 24 hours of (a) PhGI1 and PhGI2 in wild type plants and (b) PhGI1, (c) PhGI2, (d) PhCHL, (e) PhLHY, (f) PhTOC and (g) PhELF4 in iRNA::PhGI1 T1 lines 3.7, 4.7, 8.1 compared to expression in the wild type (from ZT 0 to ZT 15 of light and from ZT 15 to ZT 24 of dark). Expression represents the normalized expression NE according to the formula (NE) = 2^-(Ct experimental – Ct normalization). Three samples were analyzed for each time point and error bars indicate the standard deviation. Asterisks indicate statistical significance between wild type and iRNA lines with *P < 0.05; **P < 0.01; ***P < 0.001 according to Student’s T-test.

