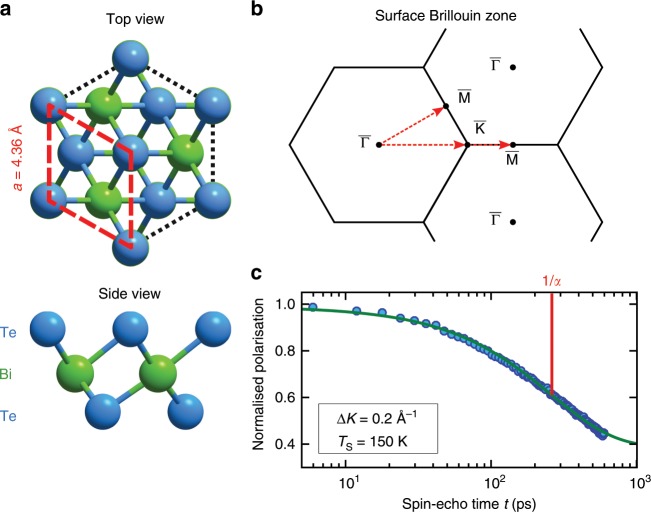
Fig. 1. BiTe structure and dynamics measurements from the lineshape broadening.
a Top and side view of the (111) surface of BiTe. The surface layer is terminated by a Te layer and the red rhombus highlights the hexagonal surface unit cell. b Surface Brillouin zone with the corresponding scanning directions. c A typical intermediate scattering function (ISF) showing the normalised polarisation versus spin-echo time . The measured data (filled circles) is fitted with a single exponential decay ((1), solid green line) characterised by the dephasing rate . The logarithmic time axis shows that a single exponential provides a good description of the experimental data.

