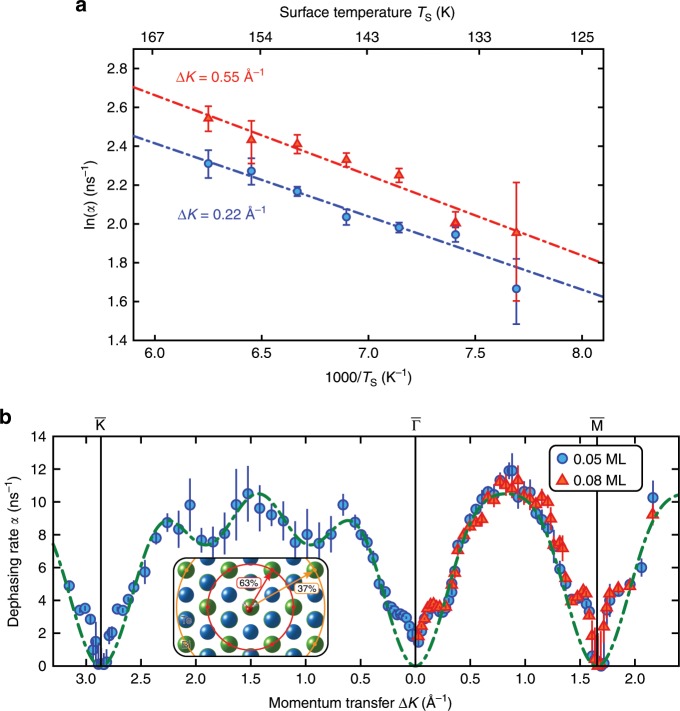
Fig. 2. Dephasing rates as determined from measurements of .
a Arrhenius plot showing the temperature dependence at two different momentum transfers along the -azimuth for the diffusion of water on BiTe(111). The measurements were taken at an HO coverage of 0.05 ML. b Momentum transfer dependence for the diffusion of HO on BiTe(111) at a fixed temperature. The measurements were taken at a constant surface temperature of and a water coverage of 0.05 ML (blue circles) and 0.08 ML (red triangles), respectively. The dash-dotted line corresponds to the analytic model for jump-diffusion with jumps on a hexagonal lattice to nearest and next-nearest sites as illustrated in the small inset. The red and yellow circles illustrate the jump distance to the next and next nearest sites, respectively. The extracted barriers and pre-exponential factors for two different momentum transfers as well as the pre-exponential hopping rate for the diffusion process at 150 K are given in Table 1. The error bars correspond to the confidence bounds () upon determination of from the measurements of —see text.

