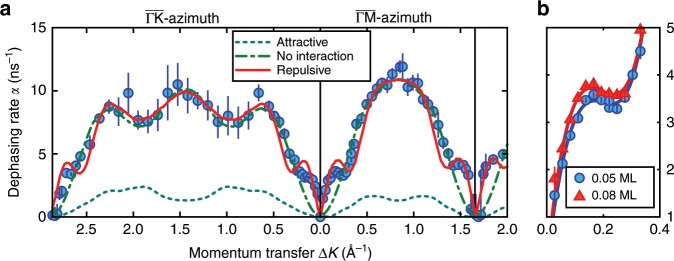
Fig. 4. Comparison of the experimental dephasing rates with kinetic Monte Carlo simulations and the coverage dependence of .
a Momentum transfer dependence for the diffusion of HO on BiTe(111) at 150 K. Experimental results for a coverage of 0.05 ML are shown as discrete points. The red solid line shows as extracted from a kinetic Monte Carlo simulation where repulsive dipole–dipole forces between the individual water molecules are included. Attractive interactions (turquoise dashed line) give dephasing rates much lower than the experiment, while diffusion without forces (green dash-dotted line) does not reproduce the structure around the zone centre (see text). b A close-up of the experimental dephasing rates in Fig. 2(b) along the -direction for two coverages: 0.05 ML, (red line and points), and 0.08 ML (blue line and points). The observed increase in dephasing rate below 0.3 Å−1 confirms the presence of repulsive interactions. The error bars correspond to the confidence bounds () of .

