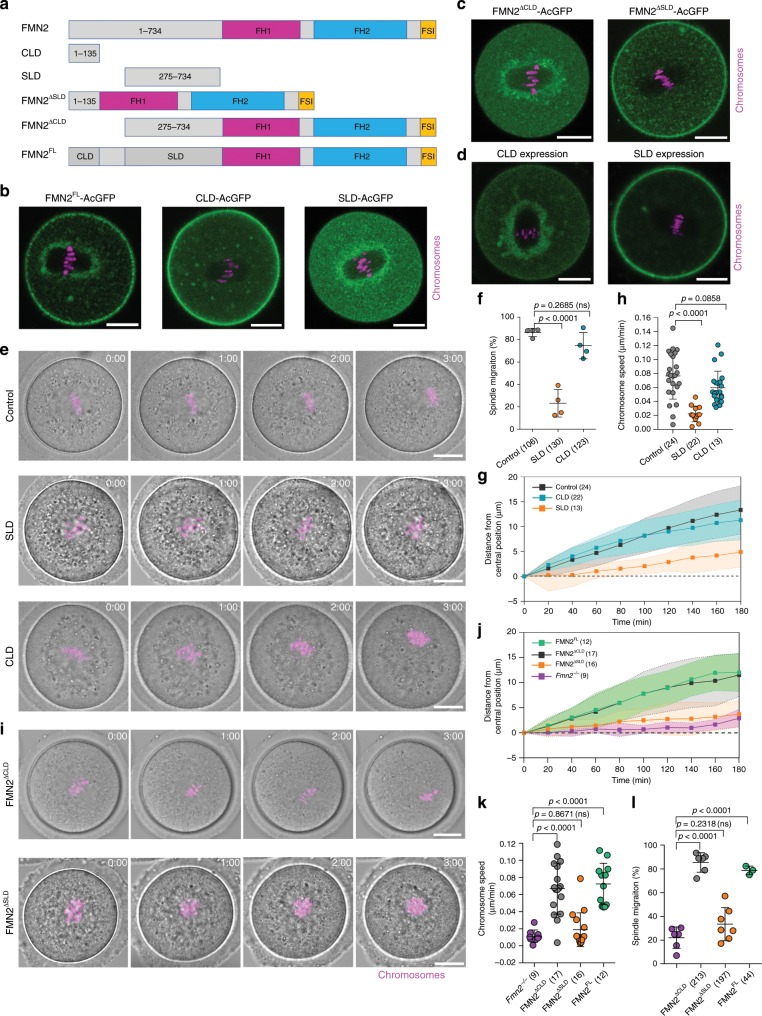
Fig. 1. Spindle peripheral targeting of FMN2 is necessary and sufficient for MI spindle migration.
a Schematic diagrams showing various FMN2 constructs used in this study. FH1: formin homology domain 1; FH2: formin homology domain 2; FSI: formin–spire interaction. b Images showing the localization of full length FMN2 (green), aa 1–135 region of FMN2 (cortical localization domain: CLD) and aa 275–734 (spindle periphery localization domain: SLD) in wild-type oocytes. Scale bar, 20 µm. c Representative images (green) show the localization of FMN2∆CLD and FMN2∆SLD in wild-type oocytes. Representative results, n = 23 (left) and 7 (right). Scale bar, 20 µm. d Representative images show the effect of SLD and CLD expressions on full-length FMN2 localization. Representative results, n = 5 (left) and 20 (right). Scale bar, 20 µm. e Representative time-lapse images of spindle/chromosomes migration in wild-type oocytes or oocytes with SLD or CLD expression. Scale bar, 20 µm. f Quantification of the percentage of oocytes that underwent spindle migration after SLD and CLD expressions in wild-type oocytes from four independent experiments. g Chromosomes were tracked in oocytes as shown in e and the chromosomes movements were plotted. Data are represented as mean ± SD, from three independent experiments. h The speed of spindle/chromosomes migration was analyzed from the plots in g. Data are from three independent experiments. i Representative time-lapse images of chromosomes migration after FMN2∆SLD and FMN2∆CLD expression in Fmn2−/− oocytes. Representative results, n = 16 (upper) and 17 (lower). Scale bar, 20 µm. j The centroids of chromosomes were tracked and chromosomes movements were plotted as the distance from the initial central position over time. Data are from three independent experiments. k The speed of chromosomes migration was analyzed from the plots in j. l Quantification of the percentage of oocytes that underwent spindle migration after FMN2∆SLD, FMN2∆CLD, FMN2FL expression in Fmn2−/− oocytes. Data are from at least three independent experiments. All the data in this figure were analyzed by one side ANOVA, Tukey’s multiple comparisons test. Data are represented as mean ± SD, and oocyte numbers are indicated in brackets. Source data are provided as a Source Data file.

