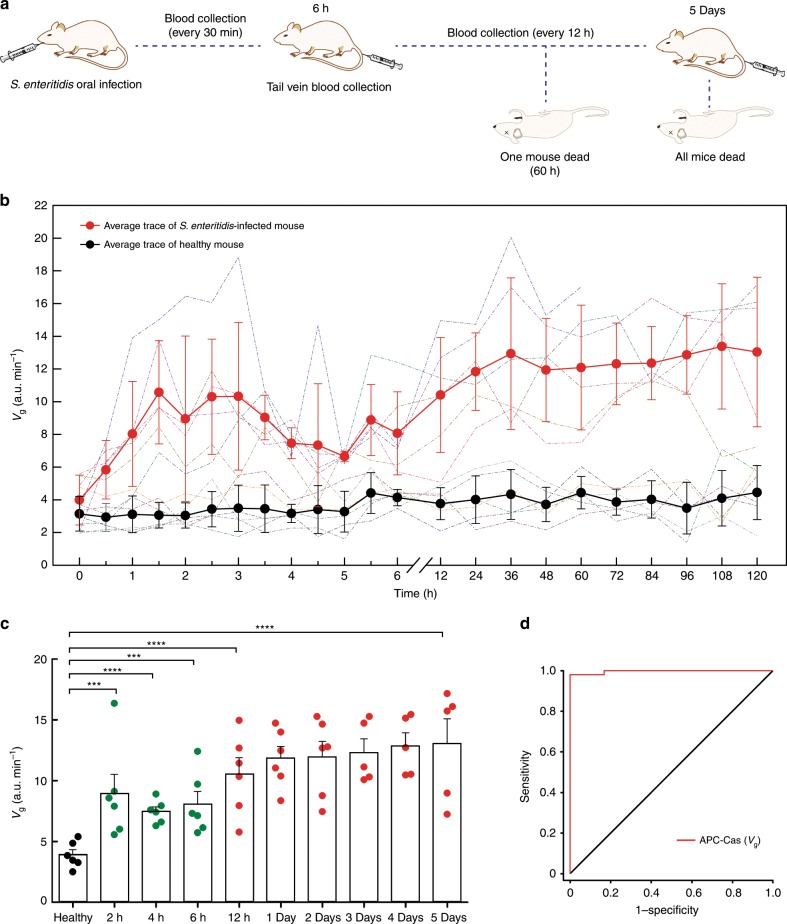
Fig. 5. Measurement of S. Enteritidis in mouse serum.
a Schematic illustration for the construction of S. Enteritidis-infected mouse model and blood collection. b S. Enteritidis expression curves versus time of six infected mice and six healthy mice (dash-dot lines), with the average trace (red line, black line) shown; error bars represent standard deviations; blood collected from 8 to 10-week-old healthy (n = 6) and S. Enteritidis-infected (n = 6) mice. c Fluorescence growth rate (Vg) of S. Enteritidis expressed in serum of infected mice and healthy mice at indicated time (paired two-tailed Student’s t test, ***P < 0.001, ****P < 0.0001). d ROC curve analysis of healthy mice (n = 6) versus S. Enteritidis-infected mice (n = 6) at early stage (2 to 6-h) and late stage (12-h to 5-day). The mice and syringes used in Fig. 5a were the templates of ChenBioDraw Ultra 14.0 software. Bars represent mean ± s.d.

