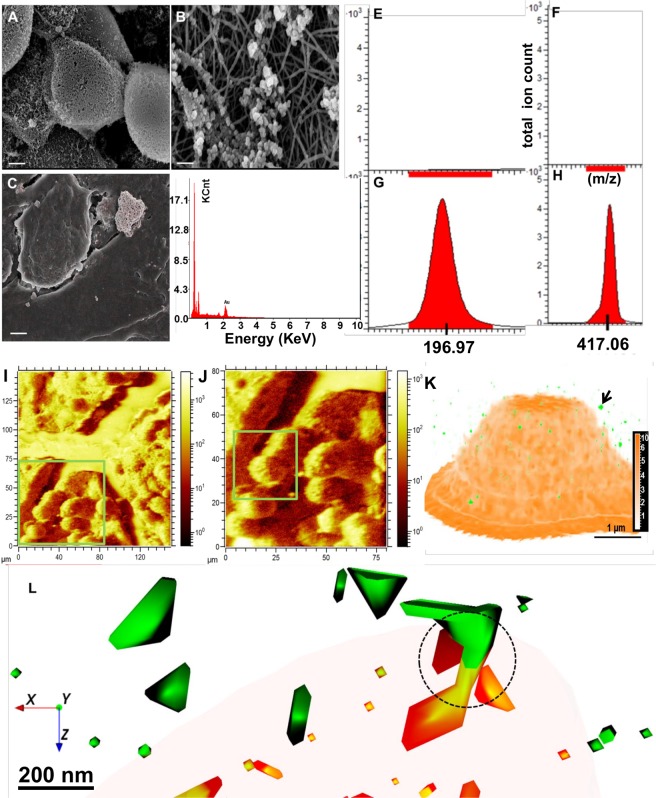
Figure 3.
Scanning electron microscopy and ToF-SIMS molecular 3D imaging of condition (A) in schematic Fig. 1. Scanning electron microscopy (A,B) and X-ray spectroscopic (C,D) analysis of A549 cells treated with 0.5 mM HAuCl4 confirms NP formation (scale bar 5 µm in A,C and 200 nm in B). The ion signals from Au+ (E, untreated A549 cells; G, ionic gold) and threonine-O-3-phosphate aureate (F, untreated A549 cells; H, A549 cells treated with low dose of ionic gold). (I,J) Topography of extracellular spherical Au nanostructures on top of A549 cells (square ROI 130 µ × 130 µ in I and 80 µ × 80 µ in J). (K) Reconstructed 3D depth profile of mineralized Au structures in A549 cell cultures. The Au+ signal (red, translucent) indicates the spherical Au-NP, whilst the signal for threonine-O-3-phosphate aureate is shown in green. (L) Enlarged view from (K, arrow) showing the combined distribution of threonine-O-3-phosphate (green) and Au-NPs signals (orange) with occasional overlap (ring).

