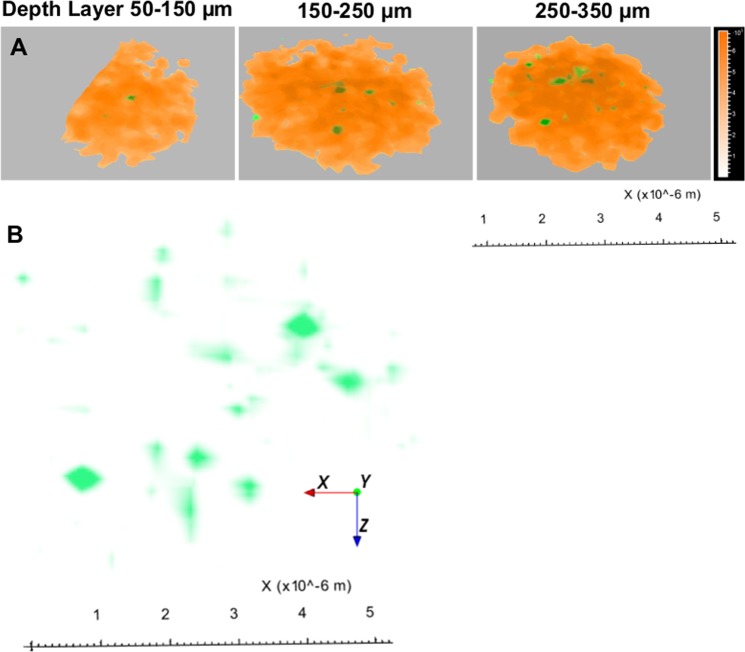
Figure 4.
The spatial distribution of threonine-O-3-phosphate as agglomerates in a 3D reconstruction of a nanoparticulate cluster. The reconstruction shows the whole NP agglomerate and successive phosphate agglomerate distribution (depicted in green) in and around deeper layers of the spherical Au-NP. (A) Slicing the spherical NPs with different z-micro stacks and 3D reconstruction from top to bottom as shown in top view: Au particle reconstructed from Au+ signals (orange, solid); threonine-O-3-phosphate aureate (green). (B) Zoomed-in view spatially isolated threonine-O-3-phosphate aureate showing m/z 417.06 green signal within a single Au-NP cluster.

