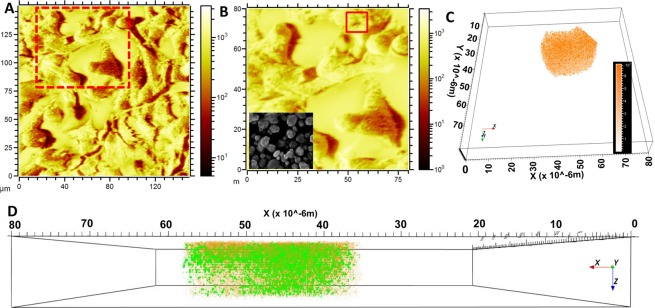
Figure 5.
The constructed ion image reveals quasi spherical Au-NPs with increasing Au ions to 1 mM Au ions. (A,B) The topography is displayed by total ion reconstruction image of the A549 cell surface. Inset show SEM image of quasi-spherical nanostructure. (C) 3D reconstructed ion image of a single cluster with the Au+ signals (m/z 196.97) picked from biomineralized cell surface. (D) The zoomed in-depth 3D reconstruction overlay of cluster shown in (C) in side view of spatiotemporal Au+ signals (orange) with threonine-O-3-phosphate aureate (green).

