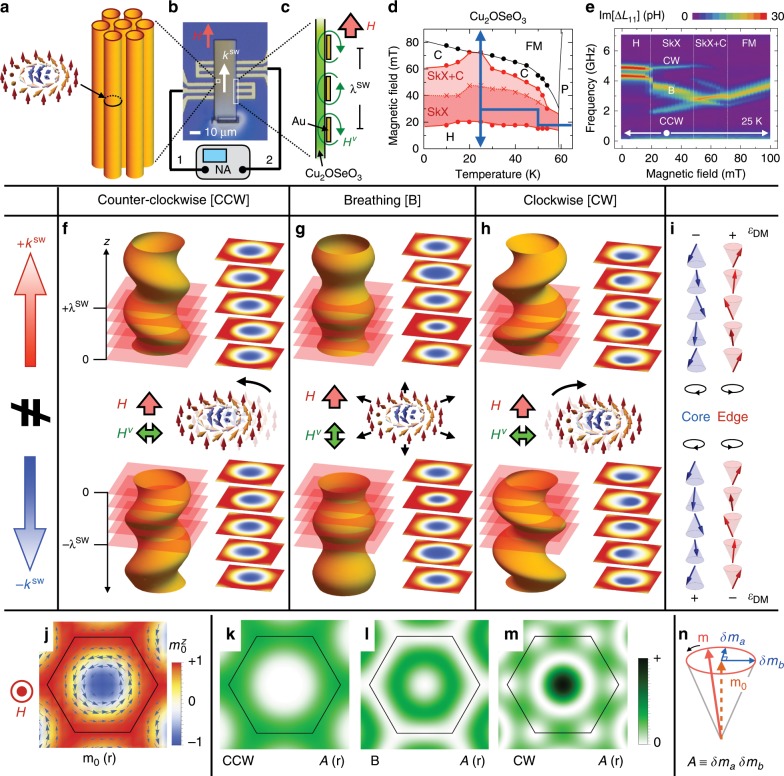
Fig. 1. Propagating excitation modes on skyrmion strings.
a Schematic illustration of skyrmion strings. b, c Top view optical image of device structure and side view illustration of a coplanar waveguide, where the AC current injected from network analyzer (NA) generates oscillating magnetic field Hν and causes spin excitation in the neighboring Cu2OSeO3. d H–T magnetic phase diagram for Cu2OSeO3, obtained with the cooling path shown by the arrows. SkX, C, H, FM, and P represent the skyrmion lattice, conical, helical, ferromagnetic, and paramagnetic states, respectively. e The corresponding H-dependence of magnetic resonance spectra ΔL11 at 25 K. f–h Schematic illustration of CCW, breathing, and CW excitation modes on skyrmion strings. The central part represents the local oscillation manner of skyrmion at the z = 0 plane. The upper and lower parts are the snapshot images describing how the spin excitation launched at z = 0 propagates on the skyrmion strings, along the ±z direction parallel and antiparallel to H, respectively. The cross-sectional images describing the size and position of skyrmion at selected z-planes (shown by red layers) are also indicated. i The direction of local magnetic moment at the core and edge position of skyrmion in each z layer. Black rounded arrows denote the sense of local moment precession in the time domain, and ± symbols indicate the sign of local DM energy gain ϵDM. j–m Calculated spatial distribution of local magnetization direction m0(r) in the ground state and local amplitude of elliptical magnetization precession for the CCW, B, and CW excitation modes in the SkX phase. In j, the arrows and background color () represent the in-plane and out-of-plane component of m0(r), respectively. n Schematic illustration of local magnetization dynamics, described by with ea and eb being the orthogonal unit vectors normal to m0. Here we define the local elliptical precession amplitude , whose spatial distribution for each mode is plotted in k–m.

