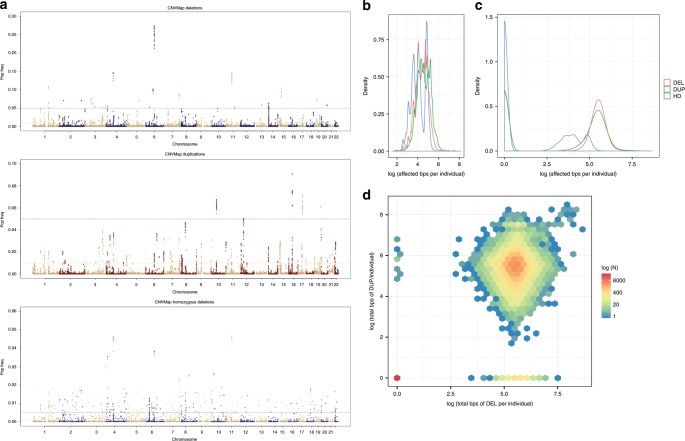
Fig. 1. Genome-wide frequency and distribution of CNVs.
a “Manhattan plot” showing the distribution of identified CNVs across the genome with genomic positions across the x-axis, including deletions (left), duplications (center), and homozygous deletions (bottom) with the y-axis showing observed frequency of each CNV in the total study population. b Histogram of duplication, deletion, and homozygous deletions frequencies for all identified CNVs as a function of total CNV burden per individual (in bps on a log10 scale). c Histogram of duplication, deletion, and homozygous deletions frequencies as a function of total CNV burden (in bps on a log10 scale) per individual. d Density plot showing each individual’s deletion burden (in bps on a log10 scale) plotted against that same individual’s duplication burden (in bps on a log10 scale). Individuals with the same event burden (bps affected) are binned into hexagon and the color correlates with the total count of individuals in each bin, reflecting that most individuals who have more duplications also have more deletions; however, there are some exceptions in patients with relatively large burdens of deletions or duplications without comparable burden of the converse.

