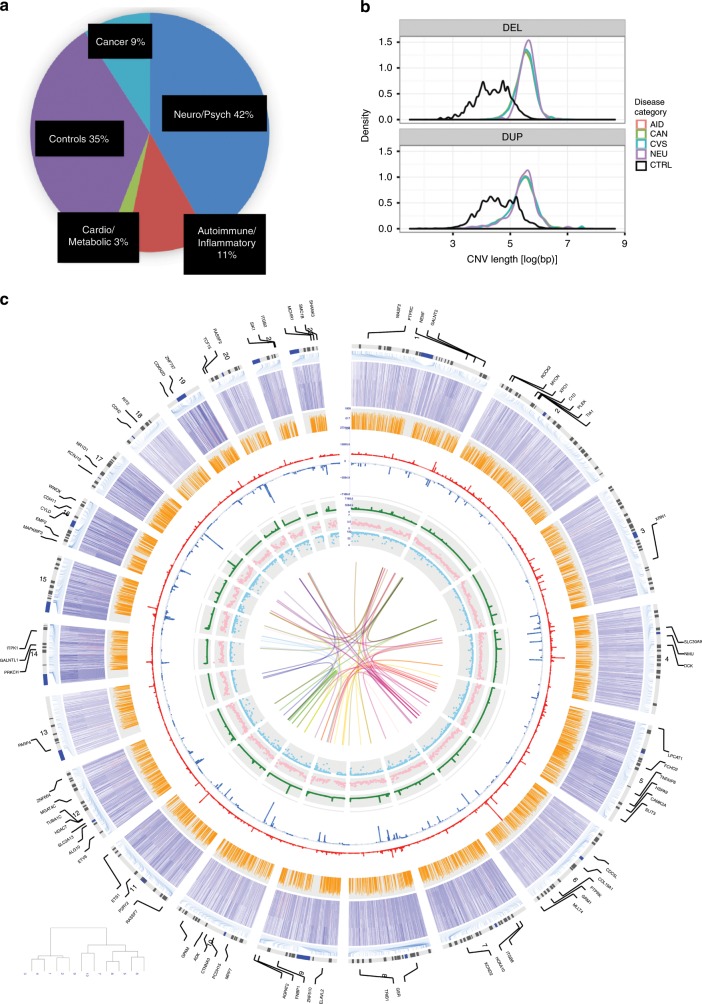
Fig. 3. Genomic landscape of disease-associated CNVs.
a Subjects (n) that are enrolled in the study based on disease category. Patients are classified into one of the four major disease categories or healthy controls. b Distribution of disease-associated deletions (top) and duplications (bottom) of CNVRs by length. Disease categories are color-coded. CNVRs associated with disease categories are on average larger than CNVRs not associated with disease categories (black-colored line), but do not significantly differ from one another. c Circos plot illustrating the distribution of CNVRs identified in the context of genomic elements. For all other layers from INNERMOST to OUTERMOST, the tracks show: sno/miRNAs (1), miRNA targets (2), conserved (PHAST) sites (3), frequency of duplication CNVRs (4), frequency of deletion CNVRs (5), recombination rates (r2) (6), expression of major EnCODE cell lines (7) corresponding to the candidate genes impacted by the respective DA-CNVRs (8). The innermost linkages reflect genes encoding the respective protein for all pairwise protein–protein interactions affected DA-CNVRs.

