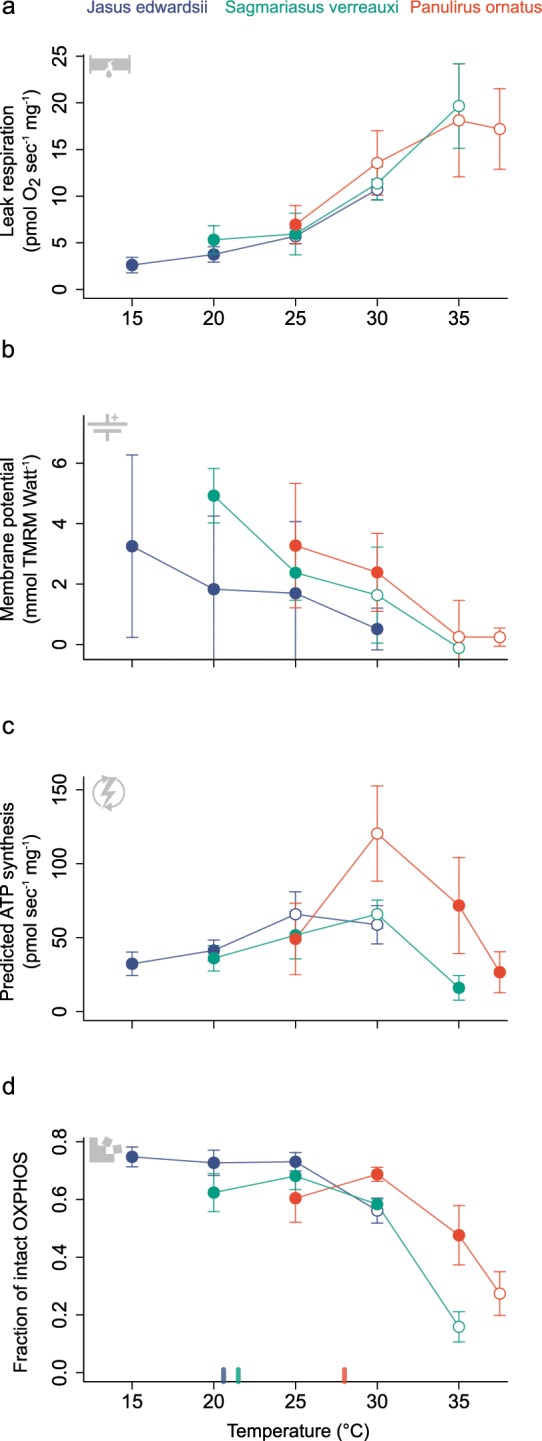
Figure 4.

Cardiac tissue change of (a) leak respiration (following addition of complex III inhibitor oligomycin), (b) mitochondrial membrane potential, (c) predicted ATP synthesis rates and (d) fraction of intact mitochondrial ATP production (i.e. oxidative phosphorylation (state 3 respiration - leak respiration)/state 3 respiration) with increasing temperatures in comparison between cold-temperate J. edwardsii (blue), subtropical S. verreauxi (green) and tropical P. ornatus (red). Data presented as means ±95% CI, n = 6–8. Open circles indicate significant difference relative to the lowest temperature for each species. Coloured tick marks at bottom x-axes indicate optimal temperatures for growth corresponding to each species (20.6 °C for J. edwardsii100, 21.5 °C for S. verreauxi34 and 28 °C for P. ornatus82).
