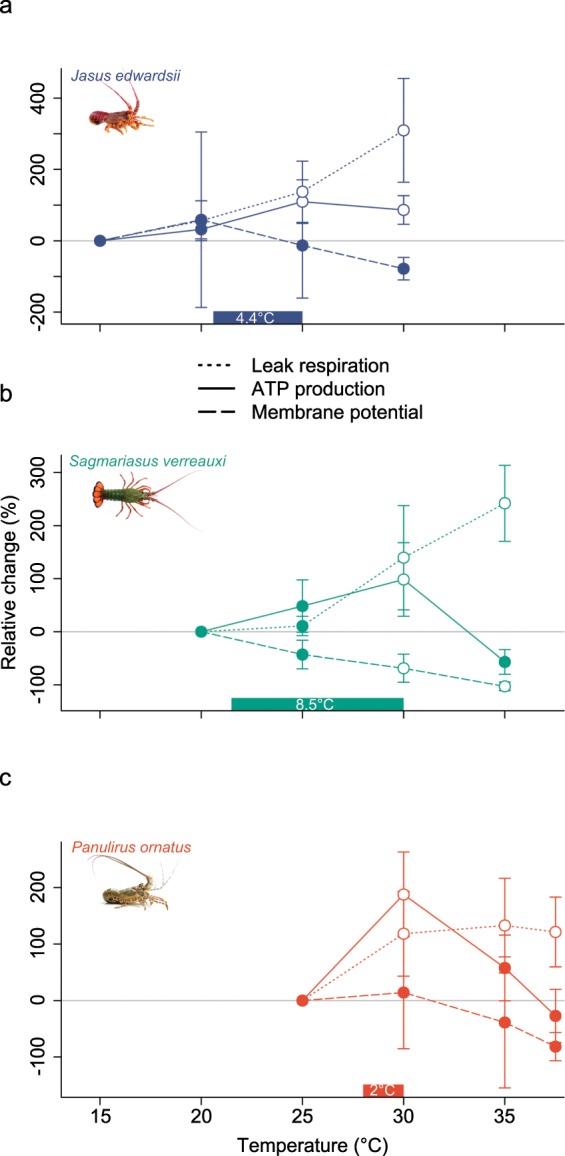
Figure 5.

Relative change (%) of spiny lobster cardiac leak respiration (dotted line), ATP production (solid line) and membrane potential (dashed line) in comparison between (a) J. edwardsii (blue), (b) S. verreauxi (green) and (c) P. ornatus (red). Data presented as means ±95% CI, n = 6–8. Open circles indicate significant difference relative to the lowest temperature for each species. Coloured bars indicate margins between optimal temperature for growth and temperatures, at which leak respiration and ATP production start misaligning. Image courtesy of Craig Mostyn Group and Seafood New Zealand.
