
Figure 1.
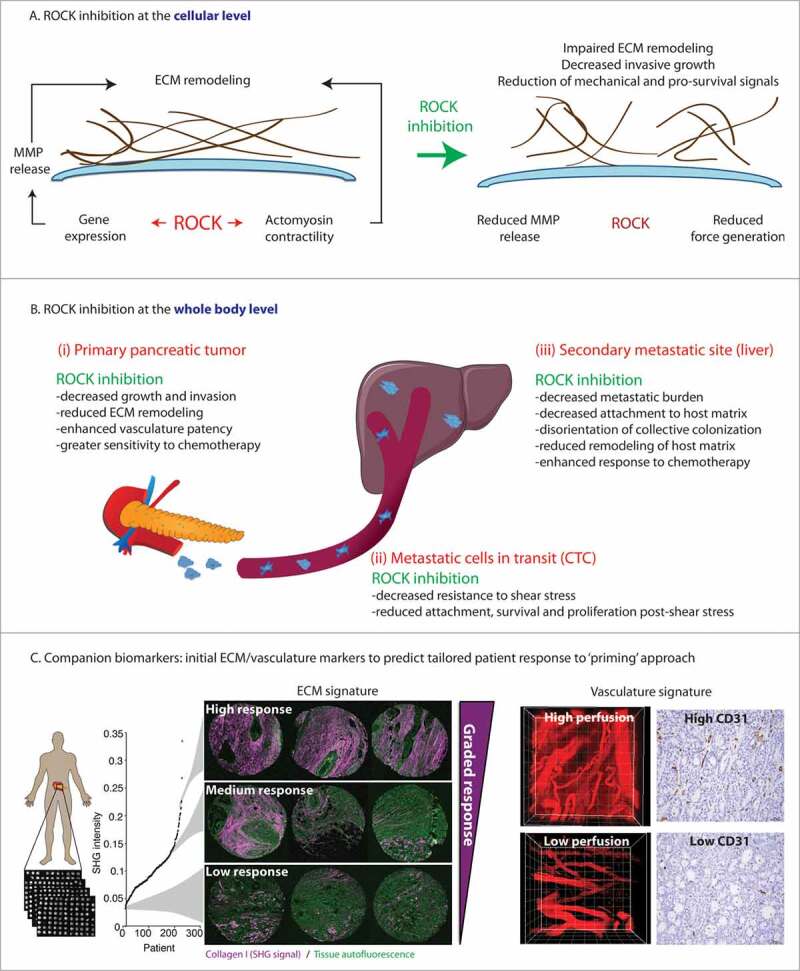
Schematic of the roles of ROCK activity and ROCK inhibition in pancreatic cancer: from cell-to-global effects to translation to patients. A. ROCK inhibition at the cellular level impairs ECM remodeling via decreased MMP release and impaired contractility. B. ROCK inhibition at the whole body, global level. Schematic representation of the effects of ROCK inhibition in primary tumor tissue (left hand panel), on circulating tumor cells (CTC, middle panel) and at secondary sites (right hand panel). Adapted from (Vennin et al., Science Translational Medicine 2017).26 Reprinted with permission from AAAS. C. Combination of ECM and vasculature markers as companion biomarkers for priming strategy. Left hand panel: Schematic representation of in-house automated Second Harmonic Generation (SHG) analysis of the ECM in the ICGC human TMA cohort, with examples of SHG signals in cores (triplicates) from patients with high, medium, or low SHG signal. Right hand panel: representative images of quantum dots and CD31 (cluster of differentiation 31) staining in tumors with high and low vascularity. Adapted from (Vennin etal., Science Translational Medicine 2017).26 Reprinted with permission from AAAS.