Figure 5.
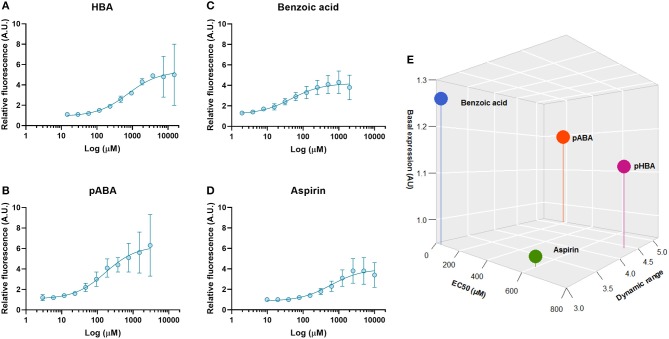
Dose-response curves obtained with the strongest benzoic acid derivative effectors of sBAD expressed in S. cerevisiae. mCitrine fluorescence was measured by flow cytometry. The relative fluorescence of mCitrine was measured with cells grown at different concentration of (A) pHBA, (B) pABA, (C) Benzoic acid, and (D) Aspirin is compared with the control condition. In (E), the affinity and dynamic parameters calculated from different the curves dose response are presented. Values are calculated as the mean of three biological replicates.

