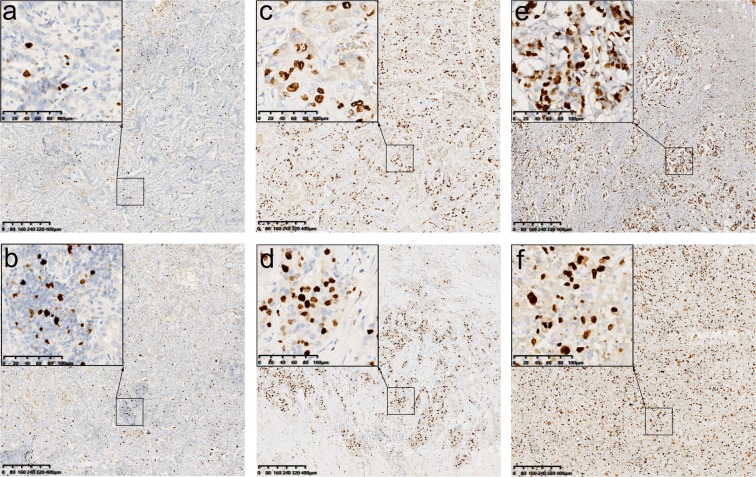
Figure 2.
Immunohistochemical analysis of Ki-67 in six representative samples. The average score across the whole section should be taken. (a,b) Represent the Ki-67low group; (c,d) represent the Ki-67 at the 30% threshold; (e,f) represent the Ki-67high group. (a) The Ki-67 index was reported at 5%. (b) The Ki-67 index was reported at 10%. (c) The Ki-67 index was reported at 30%. (d) The Ki-67 index was reported at 30%. (e) The Ki-67 index was reported at 50%. (f) The Ki-67 index was reported at 60%. (MIB1 stain, scale bar = 80 µm and scale bar of inset = 20 µm).

