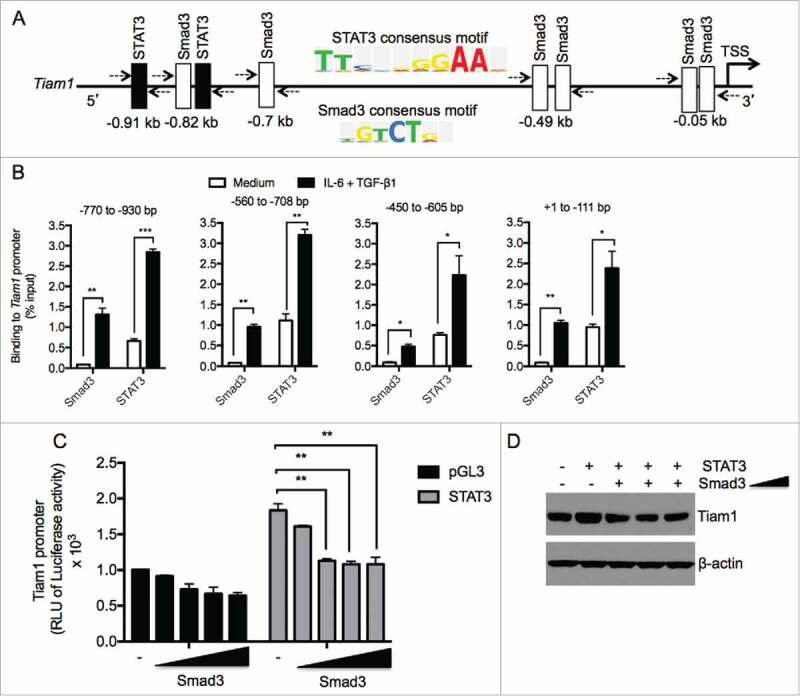
Figure 2.

STAT3 and Smad3 bind to the Tiam1 promoter in Th17 cells. (A) Several predicted binding sites for Smad3 (Open box) and STAT3 (filled boxes) were identified upstream of transcription start site (TSS) of the Tiam1 promoter using the sequence analysis algorithm TRANSFAC. Consensus binding sites for STAT3 and Smad3 are shown. (B) ChIP analysis of STAT3 and Smad3 binding to the Tiam1 promoter in Th17 cells. Naïve CD4+ T cells from WT mice were polarized under Th17 cell conditions for 3 hours and ChIP-qPCR was performed to determine STAT3 and Smad3 binding to different regions of the Tiam1 promoter relative to IgG control as indicated above the graphs. Abs used for IP are anti-STAT3, anti-Smad3 and control IgG. Total input DNA before IP was used for normalization of data. Data are presented as average ± s.e.m. of per cent input with subtraction of control IgG. (C) HEK 293T cells were co-transfected with increasing concentrations of Smad3 (0.025 – 0.5 μg/ml) in the presence or absence of STAT3 (0.5 μg/ml), and with a constant amount of Tiam1-pGL3/Renilla reporter constructs. Cells were lyzed 48 hours later and luminescence was measured. RLU, relative luciferase units. Luciferase activities were calculated as fold change relative to empty vector. Data represent mean ± SEM of a representative experiment (n = 3) each performed in triplicate. *P < 0.05; **P < 0.01 by Student t test. (D) HEK 293T cells were co-transfected with increasing concentrations of Smad3 (0.05 – 0.5 μg/ml) in the presence or absence of STAT3 (0.5 μg/ml). Protein lysates were prepared 48 hours later and Tiam1 expression was measured by Western blot. β-actin level is shown as loading control.
