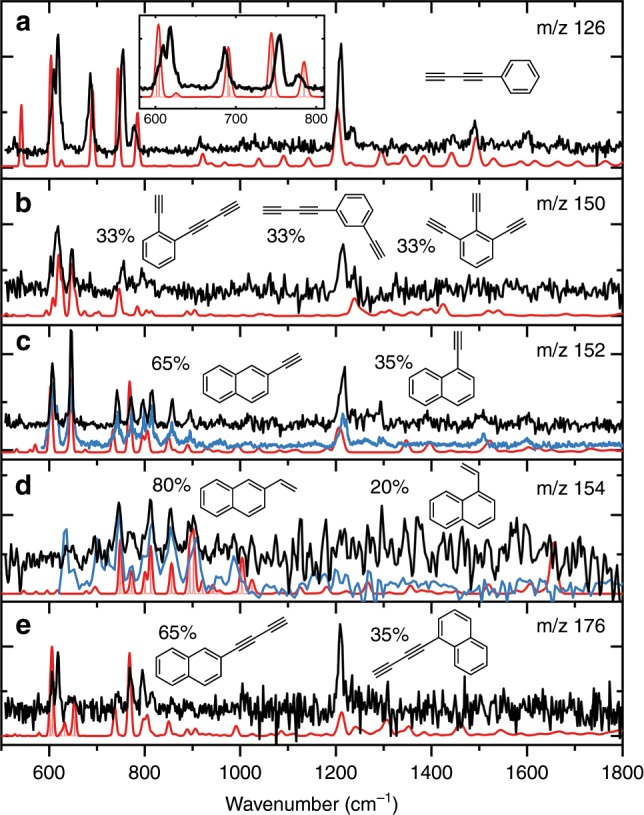
Fig. 2. Mass selected IR spectra (black) of discharge products with the assigned theoretical IR spectra (red).

The mass channels shown are m/z= a 126, b 150, c 152, d 154, and e 176 and are recorded using 36616 cm−1 UV photon energy. The molecules assigned are a buta-1,3-diyn-1-ylbenzene (diacetylenebenzene); b 1-(buta-1,3-diyn-1-yl)-2-ethynylbenzene, 1-(buta-1,3-diyn-1-yl)-3-ethynylbenzene, and 1,2,3-triethynylbenzene; c 1- and 2-ethynylnaphthalene (1EN and 2EN); d 1- and 2-ethenylnaphthalene; and e 1- and 2-(buta-1,3-diyn-1-yl)naphthalene. For b–e, two or more theoretical IR spectra of structural isomers are used to fit the experiment allowing for the determination of the ratio between the formed isomers (individual calculated spectra can be found in Supplementary Figs. 2–5). The blue trace in the m/z 152 box corresponds to an FT-IR reference spectrum taken from 1EN and 2EN combined with a 1:2 ratio, respectively. The blue trace in the m/z 154 box corresponds to an FT-IR reference spectrum taken from 1- and 2-vinylnaphthalene combined with a 1:4 ratio, respectively. The light red traces correspond to stick spectra to display adjacent peaks.
