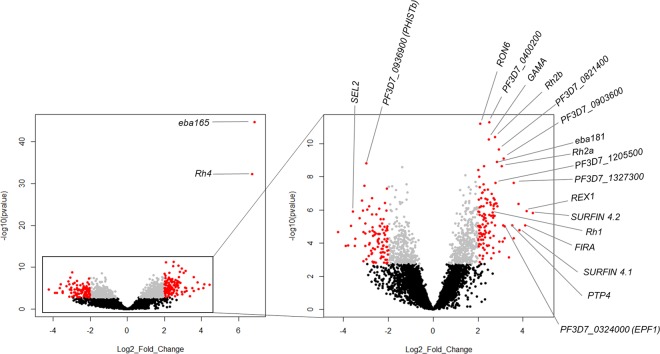
Figure 2.
Genes differentially expressed between static and suspended W2mef. Volcano plot showing the extent and significance of differentially expressed genes between suspended and baseline cultures of W2mef. Insert is a zoom in of gene expression excluding the extremely significant genes Rh4 and eba165. Grey: Benjamini-Hochberg adjusted p value < 0.01, red: absolute log2 fold change >2. Genes with symbols have no known function. Black: Benjamini-Hochberg adjusted P value > 0.01 (considered not significant).

