Figure 3.

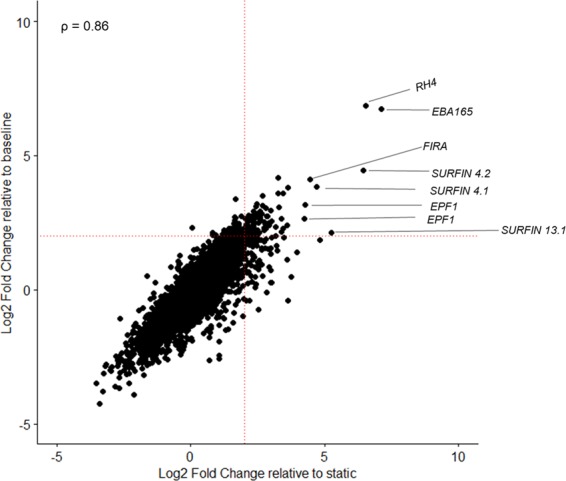
Baseline and static cultures have similar gene expression patterns in comparison to suspended W2mef. Differential expression analyses were conducted for baseline vs suspended (baseline; vertical axis) and then static vs suspended (static; horizontal axis). A spearman rank correlation plot comparing the differential gene expression between baseline and suspended culture (vertical axis) as against static and suspended cultures (horizontal axis) was then constructed using the log2 fold change values from each comparison. ρ is the coefficient of correlation. Red dotted lines indicate the significance threshold which was set at 4-fold increase in gene expression.
