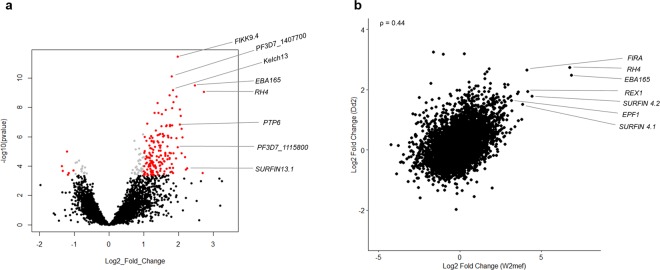
Figure 5.
Pattern of differential gene expression is similar between Dd2 and W2mef. (a) Differential gene expression analyses between baseline and suspended Dd2 shows increased expression of Rh4, eba165 in addition to other genes to be highly expressed in suspended Dd2. Grey: Benjamini-Hochberg adjusted P value < 0.01, red: absolute log2 fold change >1. Genes with symbols have no known function. Black: Benjamini-Hochberg adjusted P value > 0.01 (considered not significant). (b) A Spearman rank correlation plot of differential gene expression between suspended vs baseline W2mef (horizontal axis) and suspended vs baseline of Dd2 (vertical axis) shows similarities in the expression pattern between suspended cultures of the two strains. ρ is the coefficient of correlation.

