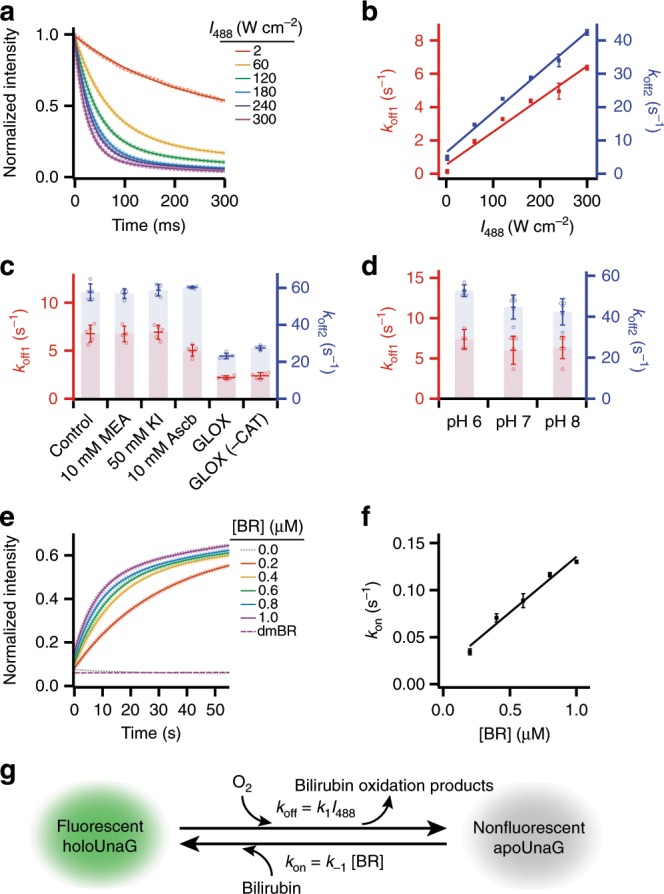
Fig. 2. Kinetic study of the photo-switching process.

a Time-dependent fluorescence decay of holoUnaG under different irradiation intensity of the 488-nm laser source. The fluorescence intensities were recorded with 5-ms time resolution. Dotted lines are the averaged low decay curves, and solid lines indicate bi-exponential fits to the decay curves. b Off-switching rates (koff1 and koff2) of holoUnaG under various laser intensities obtained from a. Linear fits (solid lines) gave first-order kinetic rate constants for the bleaching reactions. c Off-switching rates at 300 W cm−2 of intensity in different imaging buffer supplements such as β-mercaptoethylamine (MEA), potassium iodide (KI) and ascorbic acid (Ascb). Only the oxygen scavenging systems based on glucose oxidase and catalase (GLOX and CAT) significantly slowed down the fluorescence decay, indicating that the major photo-degradation pathway of holoUnaG is the photo-oxidation. d Off-switching rates at 300 W cm−2 of intensity in different pH conditions. Little notable differences were observed. e Time-dependent fluorescence recovery of bleached holoUnaG in various concentration of external BR from 0.0 to 1.0 μM (dotted lines) and in photo-damaged BR (dmBR, purple dashed line). Solid lines indicate the fitting results using Supplementary Equation 14. The fluorescence intensities were recorded with 1-s time resolution. f On-switching rates (kon) of holoUnaG in different BR concentrations obtained from c, displayed with a linear fit. g Proposed two-state fluorescence switching model of holoUnaG. Light-induced oxidation of BR inside of holoUnaG by dissolved oxygen turns off the fluorescence, whereas the reverse reaction is purely affected by freely diffusing BR in solution. Thus, the switching rates in both directions can be controlled individually by either the light intensity or the BR concentration. Intensities in a and e were normalized by the initial value. Error bars: standard deviations (n = 5, from independent bulk measurements of pulled-down samples).
