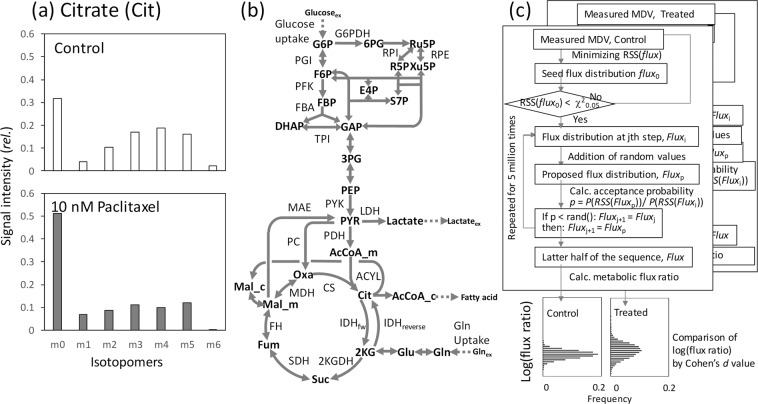
Figure 2.
Data analysis method proposed in this study. (a) Example isotope labeling data of citrate obtained from MCF-7 breast cancer cells cultured in a medium containing non-labeled glucose and [U-13C]glutamine. Data were obtained from untreated cells or cells treated with paclitaxel (an anti-cancer drug) for 24 h. The effect of the natural isotopes was removed. The data are derived from our previous 13C-metabolic flux analysis study40. (b) The metabolic model used in this study. The model includes 53 reactions and 34 metabolites. Forward and reverse reactions of isocitrate dehydrogenase (IDH) are specifically described in the figure. All abbreviations are shown in Supplementary Table S1. (c) Procedure developed for the data analysis. A seed metabolic flux distribution, flux, was produced by minimizing the RSS(flux) for the measured mass spectra (MDV) data and was used as the 0th metabolic flux distribution, flux0, when an over-fitting result was obtained. Based on a flux distribution at step j, fluxj, a proposal flux distribution, fluxp, was generated by addition of random values. The fluxp was accepted at an acceptance probability p = P(RSS(fluxp))/P(RSS(fluxj)) where P(RSS(flux)) follows a χ2 distribution. The procedure was repeated 5,000,000 times. A population of metabolic flux ratio was produced from the latter half of the chain. The procedure was repeatedly performed for two datasets (for example control and treated). Cohen’s effect size (d) was used as a quantitative measure of the magnitude of the mean difference in metabolic flux ratio between the two (control and treated) datasets.

