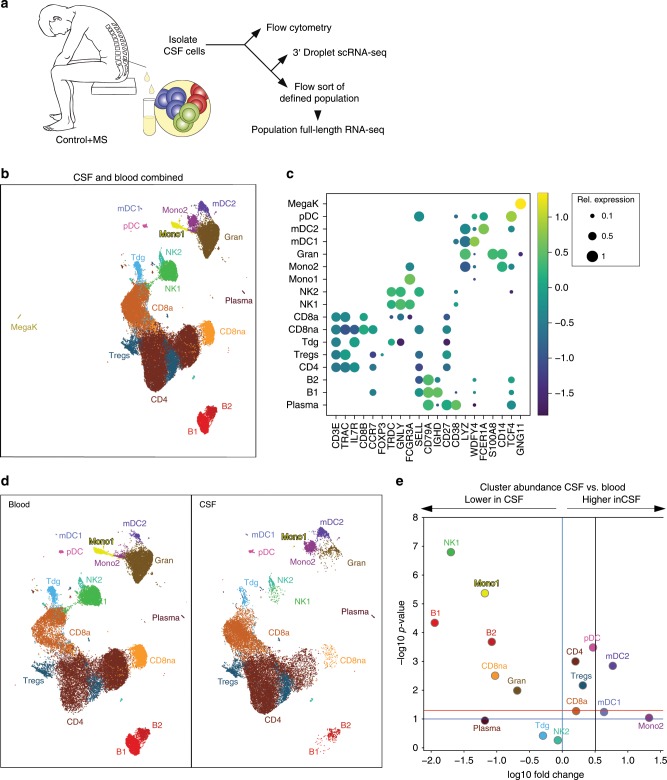
Fig. 1. Single-cell transcriptomics reconstructs the compartment-specific leukocyte composition of CSF and blood.
a Schematic of the study design (Methods). b Uniform Manifold Approximation and Projection (UMAP) plot representing 17 color-coded cell clusters identified in merged single-cell transcriptomes of blood (42,969) and CSF (22,357) cells from control (n = 4) and multiple sclerosis (MS; n = 4) patients (Methods). Cluster names were manually assigned. c Dotplot depicting selected marker genes in cell clusters. Dot size encodes percentage of cells expressing the gene, color encodes the average per cell gene expression level. d UMAP plots comparing blood (left) and CSF (right) cell clustering. Please note that the MegaK cluster is disregarded for higher resolution. e Volcano plot depicting differences of cluster abundance in CSF compared to blood plotting fold change (log10) against p value (−log10) based on beta-binomial regression (Methods). Horizontal line indicates significance threshold. Cluster key: pDC, plasmacytoid dendritic cells (DC); mDC1, myeloid DC type 1; Mono1, monocyte cluster 1 preferentially blood-derived; Mono2, monocyte cluster 2 preferentially CSF-derived; gran, granulocytes; Tdg, γδ T cells; CD8na, non-activated CD8+ T cells; CD8a, activated CD8+ T cells; Tregs, regulatory CD4+ T cells; CD4, CD4+ T cells; NK, natural killer cells; MegaK, megakaryocytes; B1/B2, B cell subsets; plasma, plasmablasts. Source data for (c) listing the differential expression values for all cells merged are provided in Supplementary Dataset 1. Source data for (d, e) listing the differential expression values for CSF vs. blood are provided in Supplementary Dataset 2.

