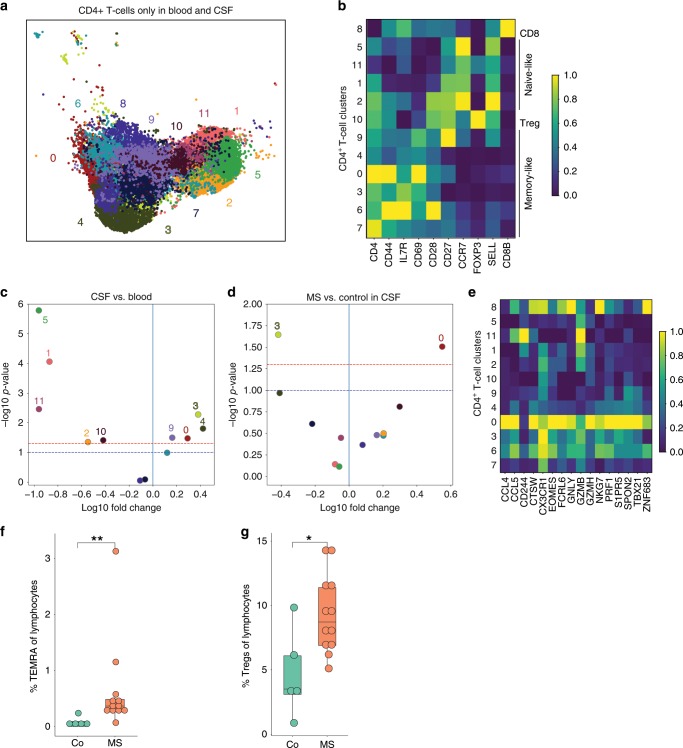
Fig. 3. Cytotoxic-like population of CD4+ T cells is induced in the CSF in MS.
a UMAP plot showing sub-clustering of all CD4+ T cells combined from blood (13,933 cells) and CSF (11,172 cells). Sub-clusters are numbered 0–11. b Heatmap depicting per cluster average expression of selected T cell subset marker genes. Expression values were normalized per gene with 0 reflecting the lowest expression and 1 reflecting the highest expression. c Volcano plot showing differences of CD4+ T cell cluster abundance in CSF compared to blood as fold change (log10) against p value (−log10) based on Student’s t-test. d Volcano plot showing differences of CD4+ T cell cluster abundance in MS compared to control within CSF based on Student’s t-test. e Heatmap showing average gene expression of selected cytotoxicity markers derived from43. Expression values were normalized per gene with 0 reflecting the lowest expression and 1 reflecting the highest expression. f The proportion of TEMRA cells (CD45RA+CD27−) among live lymphocytes in the CSF of control (co; n = 5) and MS (n = 12) patients was quantified by flow cytometry. g The proportion of Treg cells (CD25highCD127low) among live lymphocytes in the CSF of donors as in f was quantified by flow cytometry. Mann–Whitney U test, *p < 0.05, **p < 0.01. The lower and upper edges of the box plots represent the lower and the upper quartile, respectively, the horizontal line inside the box indicates the median, and the whiskers extend to the most extreme values within the 1.5 interquartile range of the lower/upper quartile. Source data for (b, e) listing the differential expression values for all CD4+ T cells are provided in Supplementary Dataset 6. Source data for (f, g) listing the TEMRA and TREGS frequencies are provided in the Source Data file.

