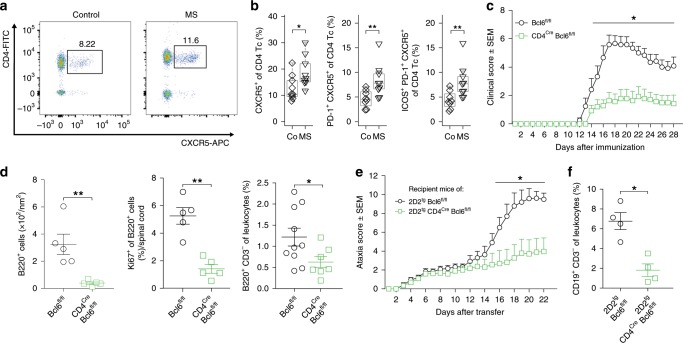
Fig. 4. TFH cells expand in the CSF in MS and promote MS animal models.
a Representative flow cytometry dotplot of CSF cells from a control and MS patient after gating on live CD3+ cells. Gating and sorting strategy is depicted in Supplementary Fig. 10a. b Proportion of CXCR5+ (left), of PD-1+CXCR5+ (middle), and of ICOS+PD-1+CXCR5+ (right) cells among live CD3+CD4+ T cells in CSF of control (co; n = 9) and MS (n = 9) patients quantified by flow cytometry. c Active EAE was induced in Bcl6fl/fl (wildtype, circles, n = 6) and CD4CreBcl6fl/fl (squares, n = 7) mice using MOG35-55 peptide (Methods). Mice were monitored daily for clinical EAE signs. One representative of three independent experiments is shown. d At day 28 after EAE induction, the density of B220+ leukocytes was quantified in spinal cord paraffin cross sections by histology (left). The proportion of Ki67+ among B220+ cells was quantified (middle). The proportion of CD3−B220+ cells was quantified by flow cytometry at peak of EAE (right). Gating strategy is depicted in Supplementary Fig. 16a. e Naive CD4 + T cells were sorted from Bcl6fl/fl2D2tg mice (wildtype, circles, n = 6) and CD4CreBcl6fl/fl2D2tg mice (squares, n = 8), differentiated in vitro (Methods), and intravenously injected into wild-type recipient mice at 5 × 10⁶ cells per mouse. Recipients were monitored for signs of EAE. One representative out of five independent experiments is shown. f At day 28 after transfer, the proportion of CD3−CD19+ leukocytes in brain and spinal cord was quantified by flow cytometry. Gating strategy is depicted in Supplementary Fig. 16b. Mann–Whitney U test, *p < 0.05, **p < 0.01, ***p < 0.005. The lower and upper edges of the box plots represent the lower and the upper quartile, respectively, the horizontal line inside the box indicates the median, and the whiskers extend to the most extreme values within the 1.5 interquartile range of the lower/upper quartile. c–f show mean ± s.e.m., source data listing the flow cytometry results and the clinical scores are provided in the Source Data file.

