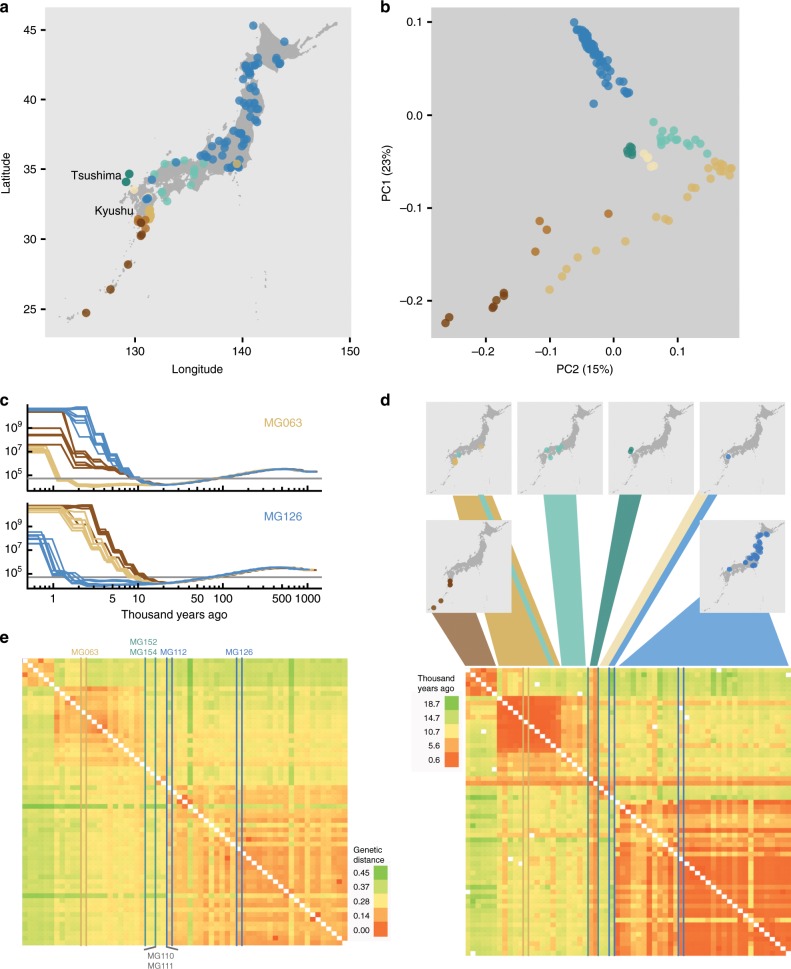
Fig. 1. Geography and genetics of Japanese Lotus accessions.
a Geographical origin of the Lotus accessions. b Principal component analysis (PCA) based on the genotypes of the Lotus accessions. a–b Accessions are colored according to their grouping in the PCA plot. c Pairwise sequentially Markovian coalescent (PSMC) curves based on pseudo-diploids generated by merging alignments of pairs of accessions. Each curve indicates the inferred population size history through time for pseudodiploid pairs including MG063 and MG126, respectively. The horizontal gray line indicates an effective population size of 5 × 10⁴. d The lower panel shows a heatmap of divergence times (years ago) for pseudodiploid pairs as estimated from the PSMC analysis with a population size cutoff of 5 × 10⁴. Accession colors are matched in a–e. e Heatmap showing the genetic distances between pairs of accessions. Genetic distance indicates the average number of allelic differences per polymorphic site in a pairwise comparison. d, e Accessions MG152 and MG154 from Tsushima Island (green), MG110 and MG111 (gray) and MG112 (blue) from central Kyushu, MG126 from northern Japan, and M063 from eastern Kyushu are highlighted as indicated in e. The accessions are shown in the same order in d and e. Source data underlying d and e are provided as a Source Data file.

