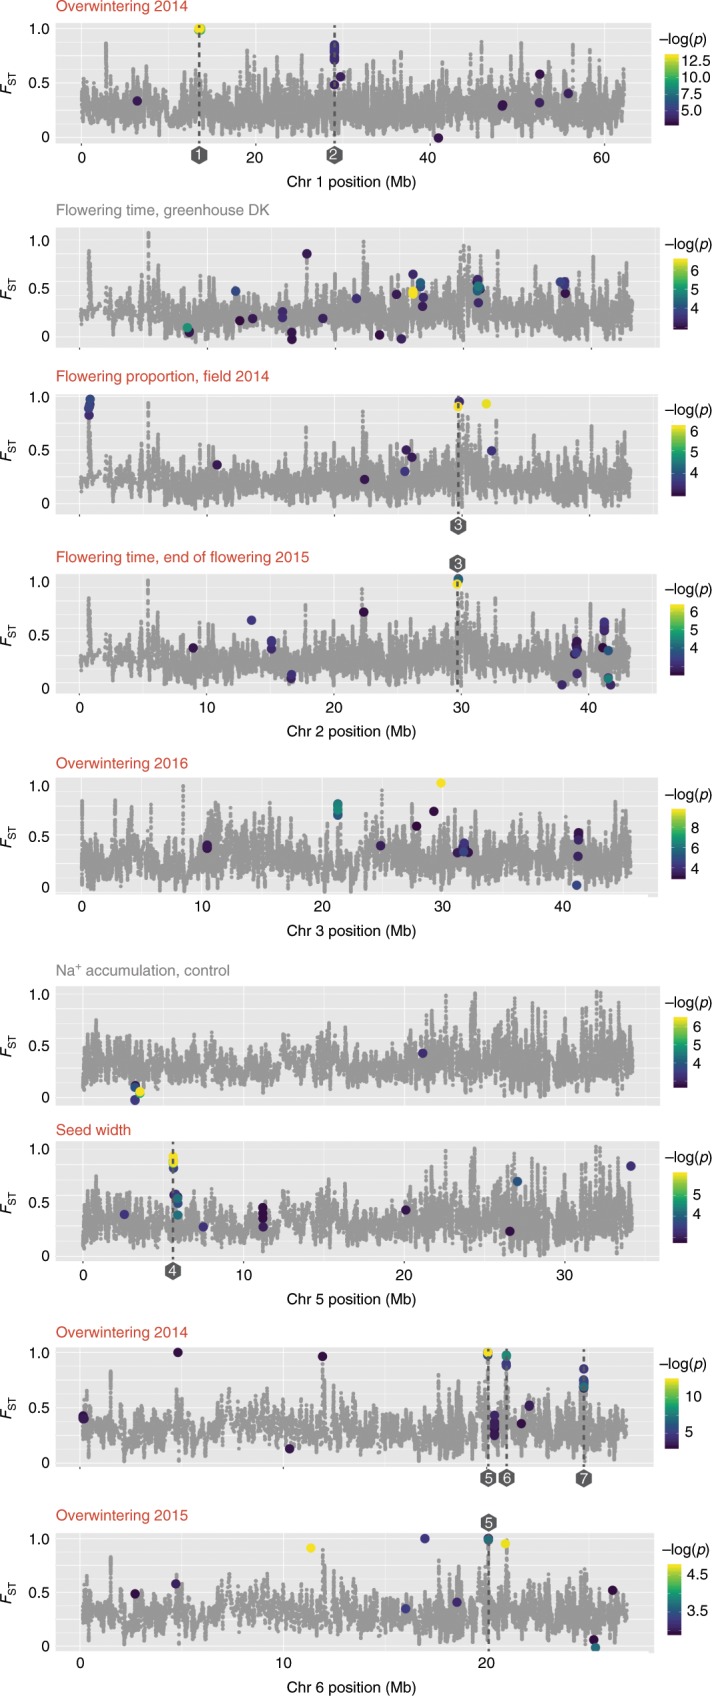
Fig. 7. Overlay of FST values and GWA results.

FST averages for 10 SNPs (gray dots) are plotted. Colored dots are shown for the 200 SNPs with highest GWA -log(p) scores for the traits indicated. The vertical positions of the colored dots indicate their FST values on the same scale as the gray dots, whereas the color indicates the GWA -log(p) score. Numbers in gray hexagons mark the peaks discussed in the main text. 1: Chr 1, a large 240 kb region 13,458,027-13,698,337. 2: Chr 1 29,029,933-29,033,958; Lj1g3v2533770 putative FERONIA receptor-like kinase. 3: Chr 2; Lj2g3v1988990 putative mitochondrial glutamate dehydrogenase, Lj2g3v1989150 similar to AtEMF2 (AT5G51230) and AtVRN2 (AT4G16845). 4: Chr 5; Lj5g3v0526490 putative mitochondrial glycoprotein similar to AT4G31930, and Lj5g3v0526510 that is similar to AT5G25170. 5: Chr 6 20,048,000-20,068,000; Lj6g3v1790920 RING-type zinc finger protein, Lj6g3v1789910 putative ubiquitin ligase, and Lj6g3v1789900 putative 1-aminocyclopropane-1-carboxylate oxidase. 6: Chr 6 20,961,109-20,970,404; Lj6g3v1887780 HBS1-like protein. 7: Chr 6 24,760,760-24,781,399; Lj6g3v2130140 and Lj6g3v2130160 putative G-type lectin S-receptor-like serine/threonine-protein kinases, and Lj6g3v2130130 putative Glutamyl-tRNA(Gln) amidotransferase subunit A protein.
