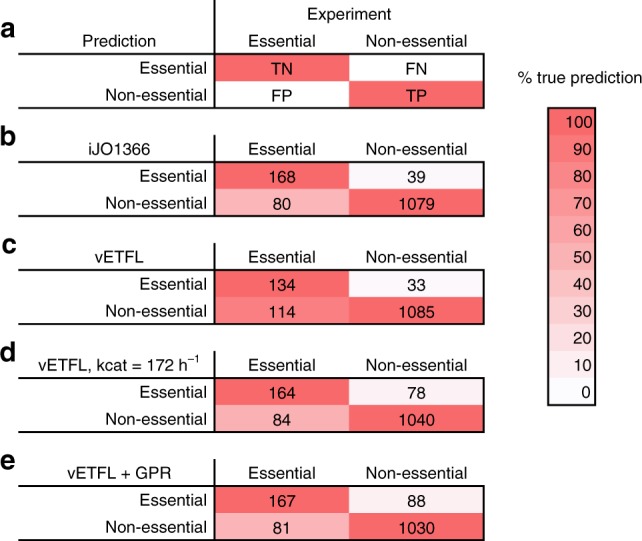
Fig. 4. Confusion matrices for gene essentiality studies.

a Conventions from Orth et al.12 for gene essentiality. TN is true negative. FN is false negative. FP is false positive. TP is true positive. The color shading represents how good the classification is. Perfect classification should have a strict red first diagonal, as shown on this example. b Gene essentiality prediction for the FBA model iJO1366, yielding a Matthew's correlation coefficient (MCC) of 0.69. c Gene essentiality prediction for the vETFL model, yielding a MCC of 0.60. d Gene essentiality prediction for the vETFL model with estimated enzymes with all , yielding a MCC of 0.59. e Gene essentiality prediction for the vETFL model, where genes without enzyme assignment were tested using gene to protein to reaction (GPR) associations from the iJO1366 model, yielding a MCC of 0.59.
