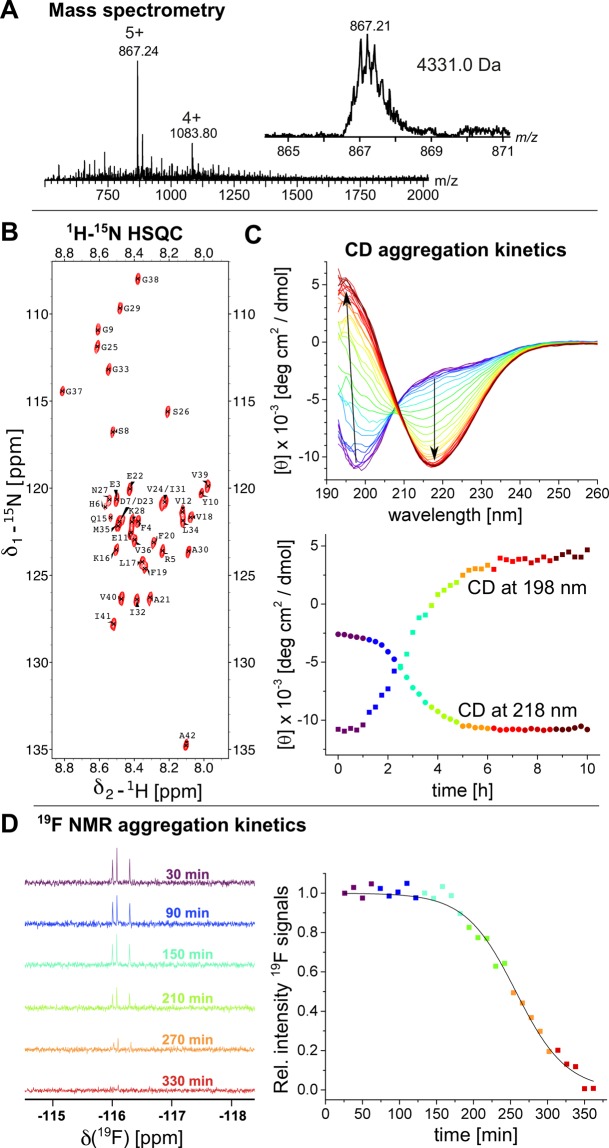
Figure 3.
(A) Mass spectrum of Aβ40 showing a pure peptide with an average mass of 4331 Da. The inset shows a zoom of the 5 + charged ion. (B) 1H-15N-HSQC spectrum of 15 μM Aβ42 recorded at 5 °C, revealing monomeric peptide. (C) Aggregation kinetics of 10 μM Aβ42 at 37 °C under continuous stirring recorded by CD spectroscopy. The spectra exhibit a structural transition from a predominantly unstructured state to a β-structure. The lower panel shows the time dependence of the CD extremes at 198 nm (squares) and 218 nm (circles), with the same color code as used for the CD spectra. (D) Aggregation kinetics of 50 μM 4FF-Aβ42 at 25 °C monitored by 19F-NMR spectra of the signals around −116 ppm, exhibiting attenuation of 4FF-signals. The color code represents the same time points in both panels.

