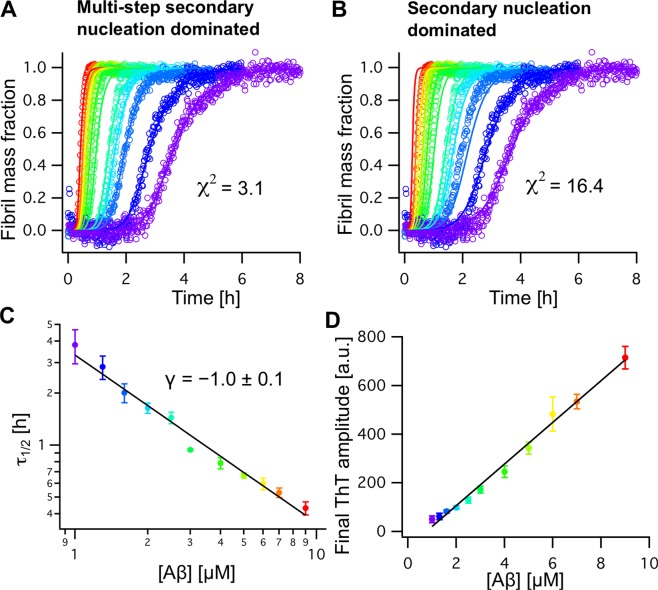
Figure 4.
(A,B) Aggregation kinetics of Aβ42 at different concentrations from 1.0 (violet) to 9.0 μM (red) recorded by ThT fluorescence experiments fitted with a multi-step (A) and simple secondary nucleation model (B). The kinetic traces fit best to the multi-step secondary nucleation model, reflected by a lower χ2 value. (C) Aggregation half times, 𝜏1/2, plotted against the initial peptide concentration, [Aβ], exhibit a γ coefficient of γ = −1.0 ± 0.1. (D) The final ThT intensity of the normalized aggregation traces in (A) exhibits a linear relation to [Aβ].

