
Fig. 4.
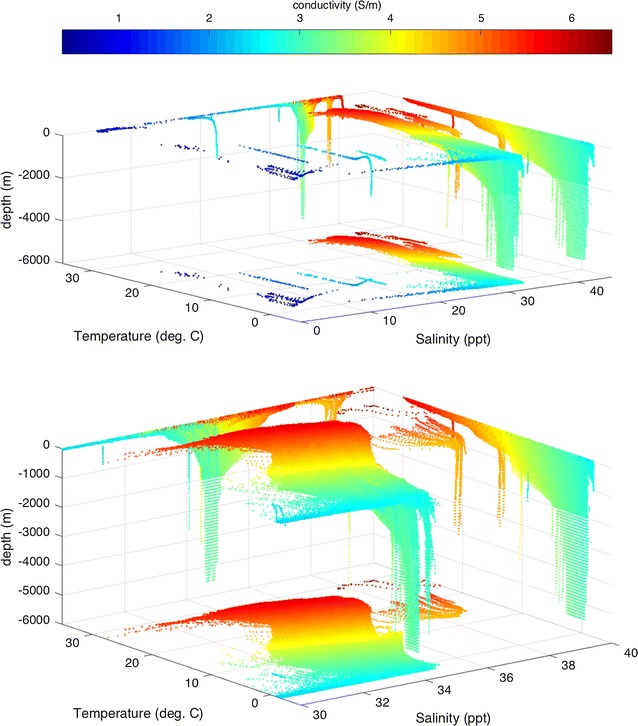
Scatter plot showing data set of global ocean conductivity (values given by color scale) as distributed in coordinates of co-located salinity, temperature, and depth. Planar projections are also included. Clusters describe distinct water mass properties from various ocean bodies. The bottom panel is a magnification of the top panel, excluding the atypical low-salinity clusters associated with inland seas (see text). Most of the variability is near the ocean surface