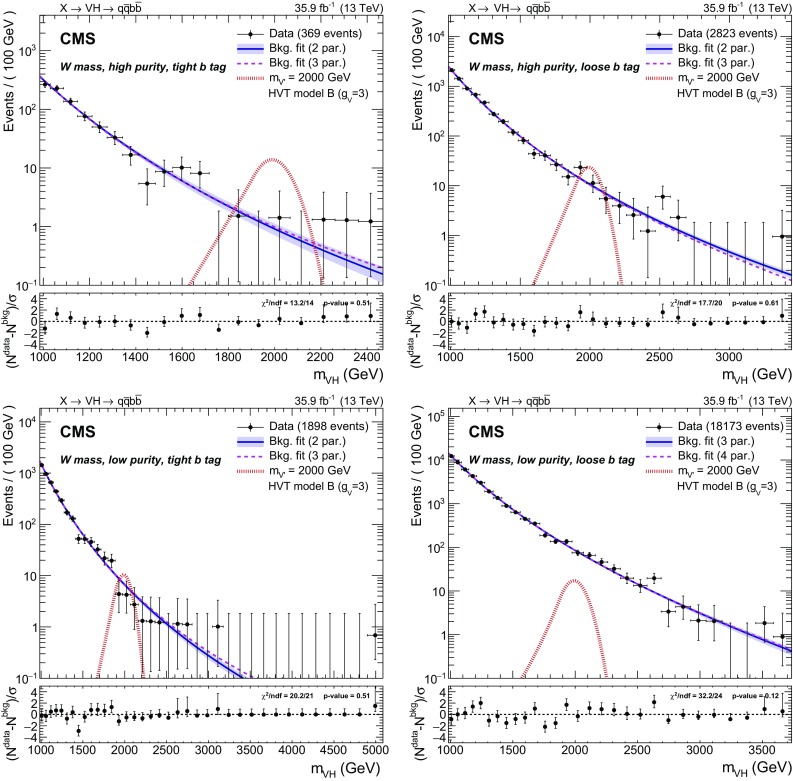
Fig. 3.

Dijet invariant distribution of the two leading jets in the mass region: high purity (upper) and low purity (lower) categories, with tight (left) and loose (right) b tagging selections. The preferred background-only fit is shown as a solid blue line with an associated shaded band indicating the uncertainty. An alternative fit is shown as a purple dashed line. The ratio panels show the pulls in each bin, , where is the Poisson uncertainty in data. The horizontal bars on the data points indicate the bin width and the vertical bars represent the normalized Poisson errors, and are shown also for bins with zero entries up to the highest event. The expected contribution of a resonance with , simulated in the context of the HVT model B, is shown as a dot-dashed red line
