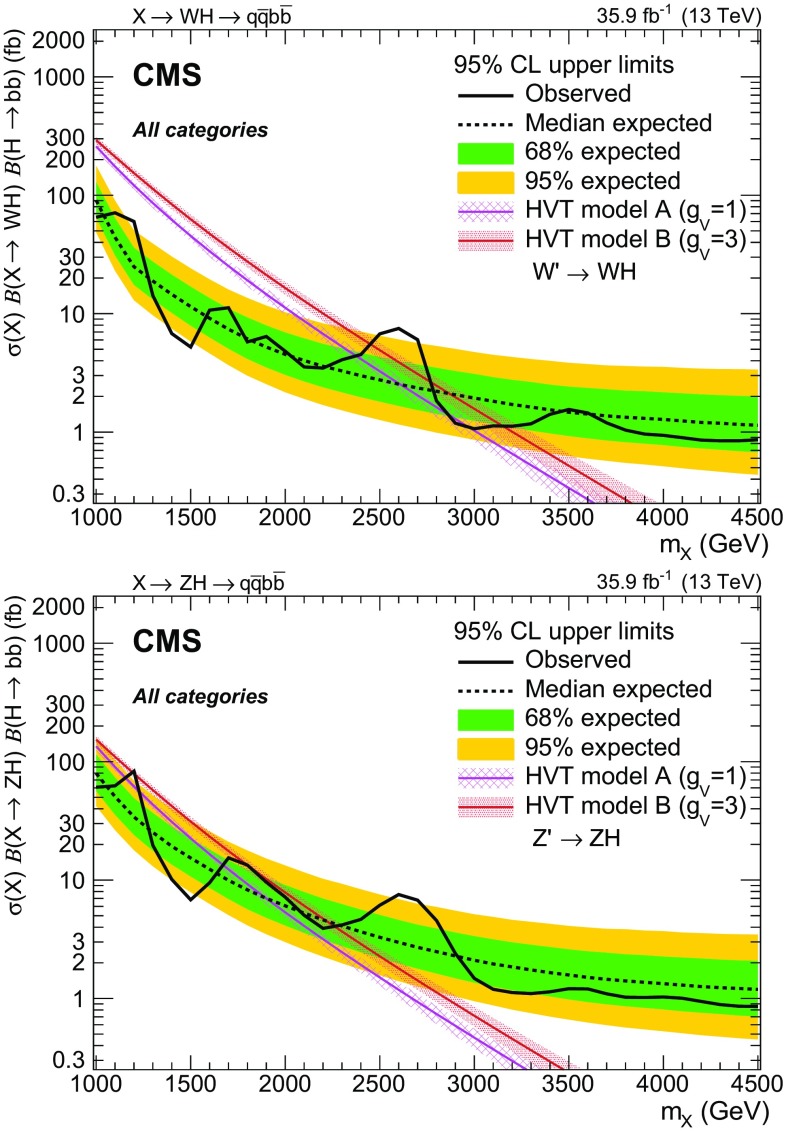
Fig. 5.
Observed and expected 95% CL upper limits on the product (upper) and (lower) as a function of the resonance mass for a single narrow spin-1 resonance, for the combination of the eight categories, and including all statistical and systematic uncertainties. The inner green and outer yellow bands represent the and standard deviation uncertainties in the expected limit. The purple and red solid curves correspond to the cross sections predicted by the HVT model A and model B, respectively

