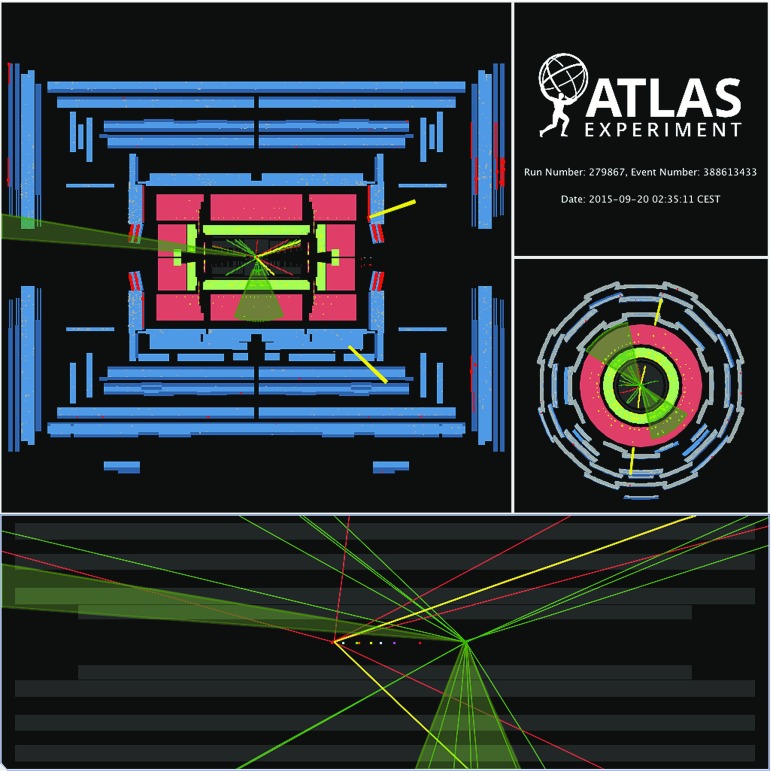
Fig. 12.
Display of candidate event (muons in yellow) containing two QCD pile-up jets. Tracks from the primary vertex are in red, those from the pile-up vertex with the highest are in green. The top panel shows a transverse and longitudinal view of the detector, while the bottom panel shows the details of the event in the ID in the longitudinal view

