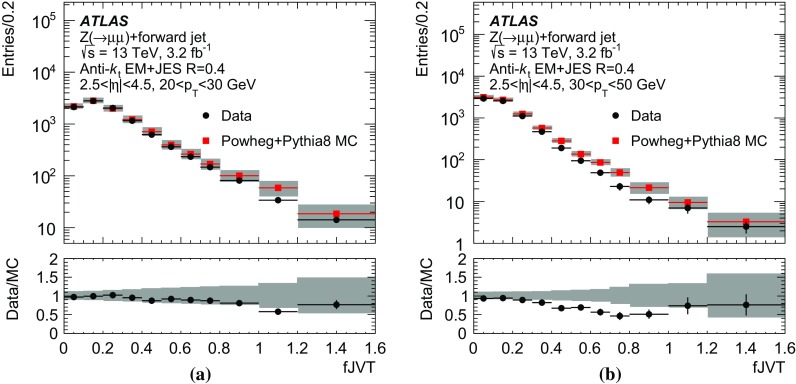
Fig. 17.

Distributions of for jets with a between 20 and 30 and b between 30 and 50 for data (black circles) and simulation (red squares). The lower panels display the ratio of the data to the simulation. The grey bands account for statistical and systematic uncertainties
