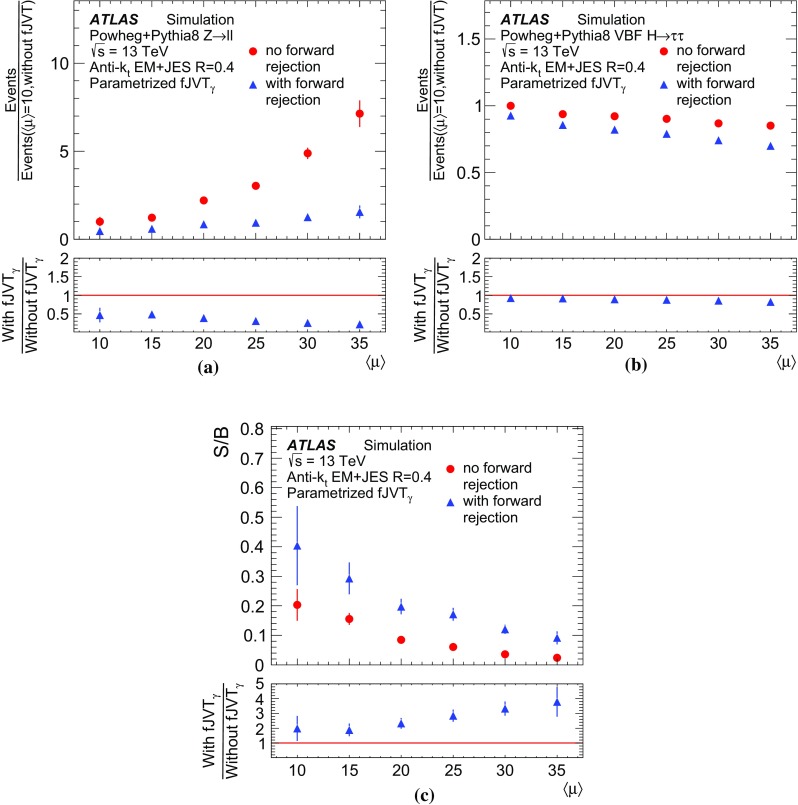
Fig. 20.

Relative expected yield variation of a and b VBF events and c signal purity as a function of the number interactions per bunch crossing (), with different levels of pile-up rejection using . The expected signal and background yields at are used as reference. Parameterized hard-scatter efficiency and pile-up efficiency are used. The lower panels display the ratio to the reference without pile-up rejection
