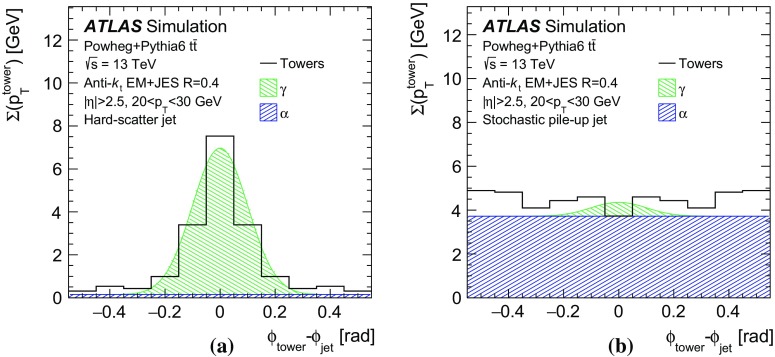
Fig. 8.
Symmetrized tower distribution projections in for an example a hard-scatter jet and b stochastic pile-up jet in simulated events. The black histogram line corresponds to the projection of the 2D tower distribution. The fit model closely follows the hard-scatter jet distribution, yielding a large Gaussian signal, while stochastic pile-up jets feature multiple smaller signals, away from the jet core

