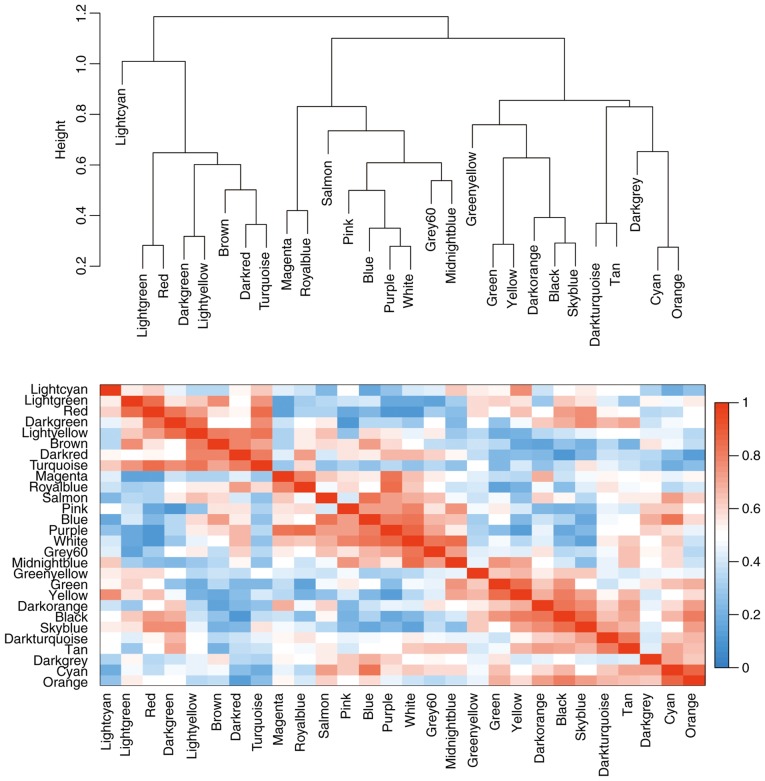
Figure 4.
Correlation of modules based on their eigengenes. Visualization of hierarchical clustering dendrogram of the eigengenes (top); the eigengene network represents the relationships among modules. Heat map of the eigengene adjacency (bottom); the colored bars on the left and below indicate the module for each row or column.

