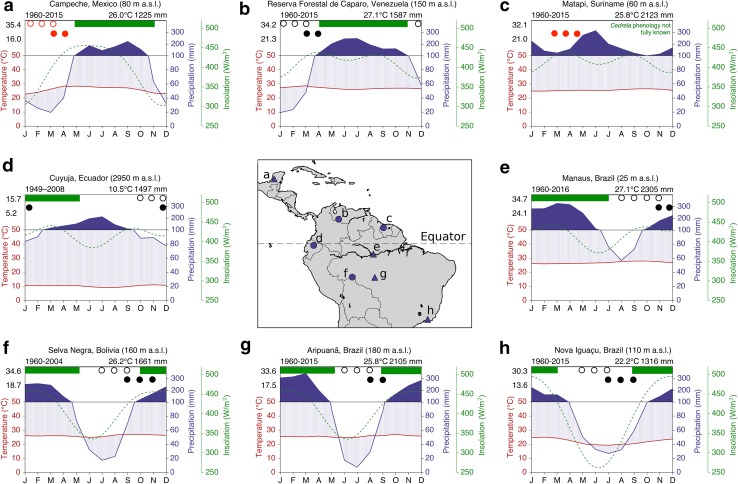
Fig. 1.
Map showing the locations and climate diagrams of the four sites sampled in this study (dark blue circles) and four sites where Cedrela growth periodicity data are available from the literature (dark blue triangles). The altitude of each site is given in m above sea level (m a.s.l.). The date range at the top left of each climate diagram is the period of temperature and precipitation observations. The values in black at the top right are the mean annual temperature and the total annual precipitation. Values in black on the left side of each diagram are the maximum and minimum annual temperatures. Note that the precipitation scale changes above 100 mm, indicated by a change to solid blue fill. Average daily insolation data are also shown (dashed green line). Horizontal green bars at the top of each graph show the main growing period for Cedrela at each of the sites. Open and filled black circles show the periods of Cedrela leaf-fall and leaf-flush, respectively, with data from systematic monitoring. Open and filled red circles show the periods of Cedrela leaf-fall and leaf-flush, respectively, with data from casual observations. Sources for the climate, insolation, growth and phenology data used for each site are given in the “Methods”

