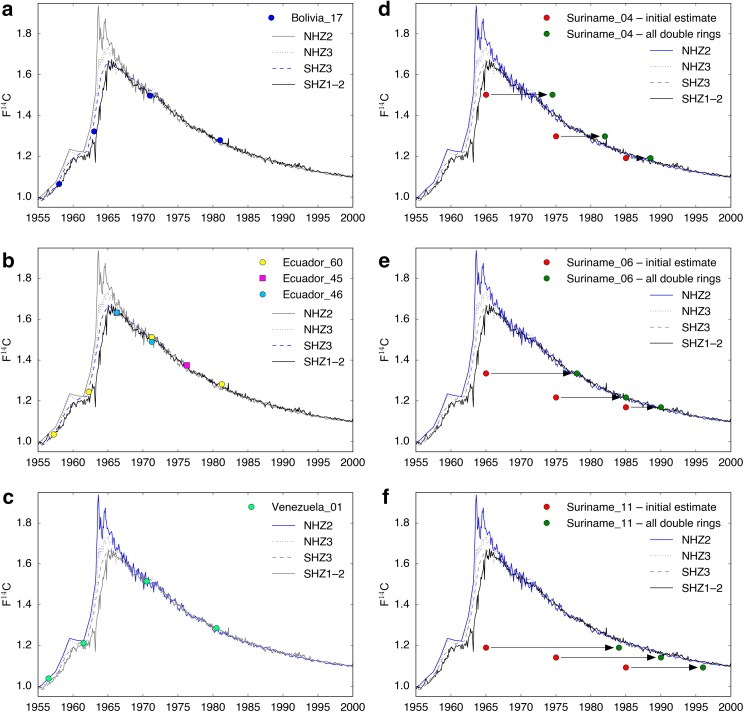
Fig. 2.
F14C values from 14C-AMS analysis (circles) plotted over the northern hemisphere (NH) and southern hemisphere (SH) 14C bomb datasets compiled by Hua et al. (2013). a–c Samples from Bolivia (tree 17), Ecuador (trees 45, 46 and 60) and Venezuela (tree 01) all fall on top or between these calibration curves. d–f Samples from Suriname (trees 04, 06 and 11) plotted using the initial sample age estimates (red circles) and the age estimates if trees are assumed to regularly form two rings per year (green circles). In each panel, the location-specific atmospheric 14C calibration curve presently accepted by the radiocarbon community (as per Hua et al. 2013) is highlighted in blue

