
Figure 2.
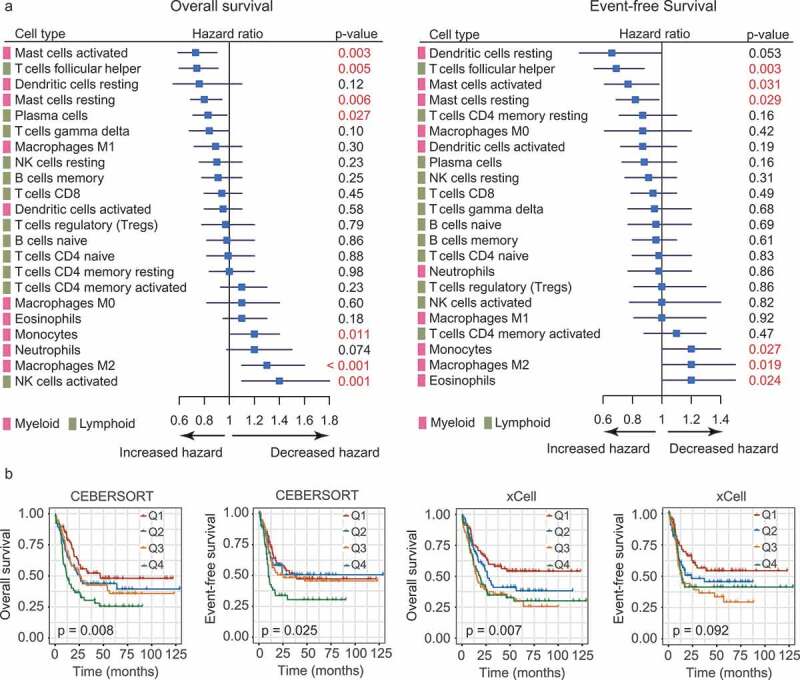
Prognostic associations of TIL subpopulations in AML. (a) Forest plots showing the associations of continuous TIL concentrations with overall survival (OS, left) and event-free survival (EFS, right) in Cohort 2. The hazard ratios (HRs) were plotted with lower and upper 95% confidence intervals (CI) in the forest plots. p-values were obtained from a univariate Cox regression analysis. (b) OS and EFS in AML patients (Cohort 2) defined by quartiles (Q1-Q4) of M2 macrophage abundances. The relative abundances of M2 macrophages were estimated by CIBERSORT (left panel) and xCell (right panel), respectively. Depicted p-values were calculated from log-rank tests.