Figure 3.

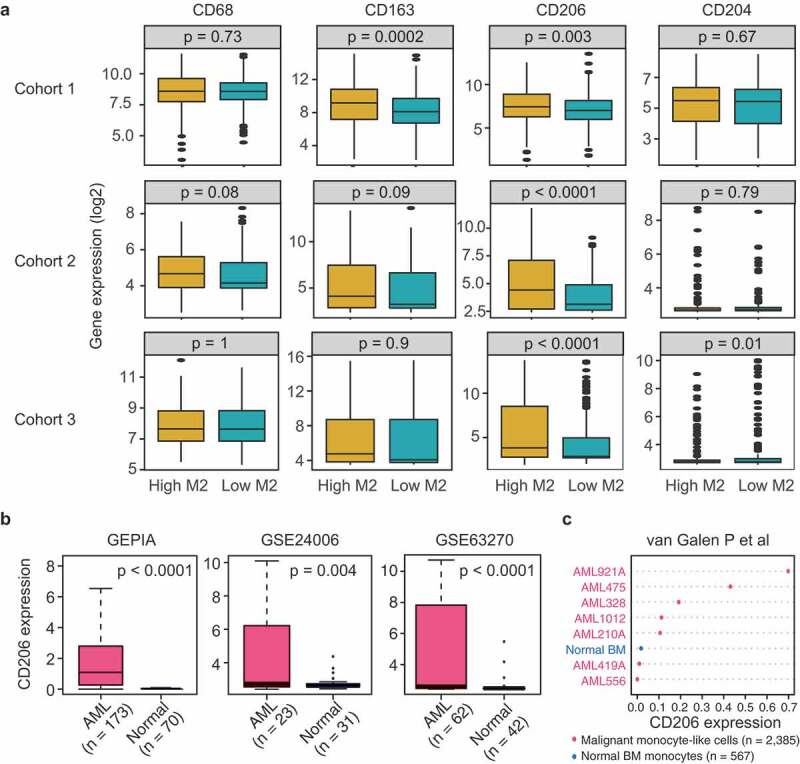
CD206 expression reflects variation in M2 macrophage abundance and is more highly expressed in AML patients than normal controls. (a) mRNA levels of M2 marker genes (CD68, CD163, CD206, and CD204) between patients with high (above median) and low (below median) M2 macrophage abundances in three AML cohorts. Data are presented as median and IQR. The p-value from Wilcoxon test is shown. (b) Boxplots showing CD206 expression in AML and normal controls using GEPIA (http://gepia.cancer-pku.cn/detail.php?gene=&clicktag=boxplot) and two published datasets (GSE24006 and GSE63270). (c) Dot chart comparing the expression levels of CD206 in sorted monocyte-like cells from AMLs (n = 2385) and monocytes from normal BM (n = 567), as assessed by single-cell RNA-sequencing (van Galen P et al., 2019).
