
Figure 6.
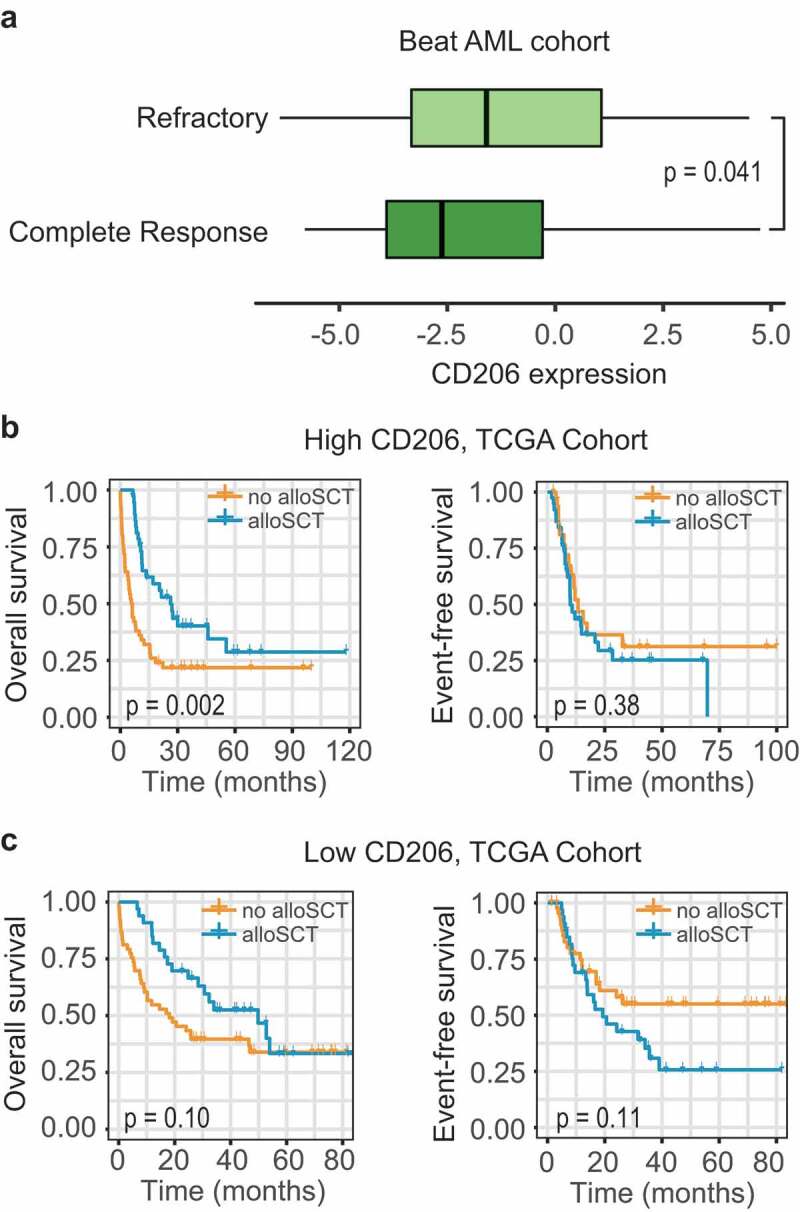
Association between CD206 expression and treatment response. (a) Boxplot showing CD206 expression in samples from patients achieving a complete response (n = 203) and patients showing a refractory disease (n = 116) in the Beat AML cohort. The p-value from Wilcoxon test is shown. (b and c) Kaplan–Meier curves of OS and EFS for patients with high (b) or low (c) CD206 expression as stratified by treatment options (alloSCT versus no alloSCT) in the TCGA cohort. alloSCT, allogeneic stem cell transplantation.